. 2013 Apr 23;6(272):ra26.
doi: 10.1126/scisignal.2003312.

Pheromone-induced morphogenesis improves osmoadaptation capacity by activating the HOG MAPK pathway

Affiliations

Pheromone-induced morphogenesis improves osmoadaptation capacity by activating the HOG MAPK pathway

Rodrigo Baltanás et al. Sci Signal. .

Abstract

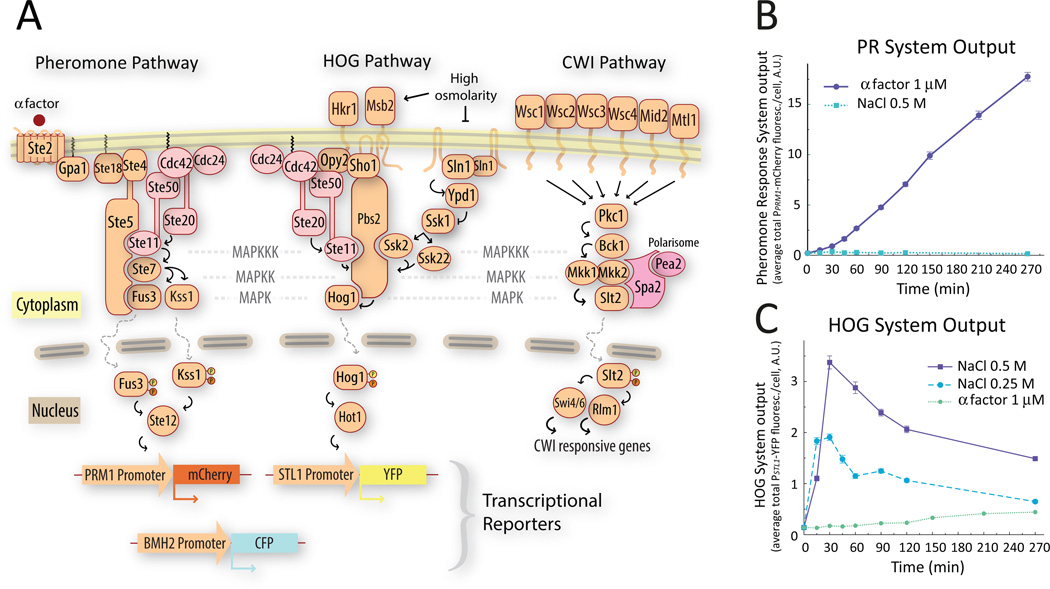
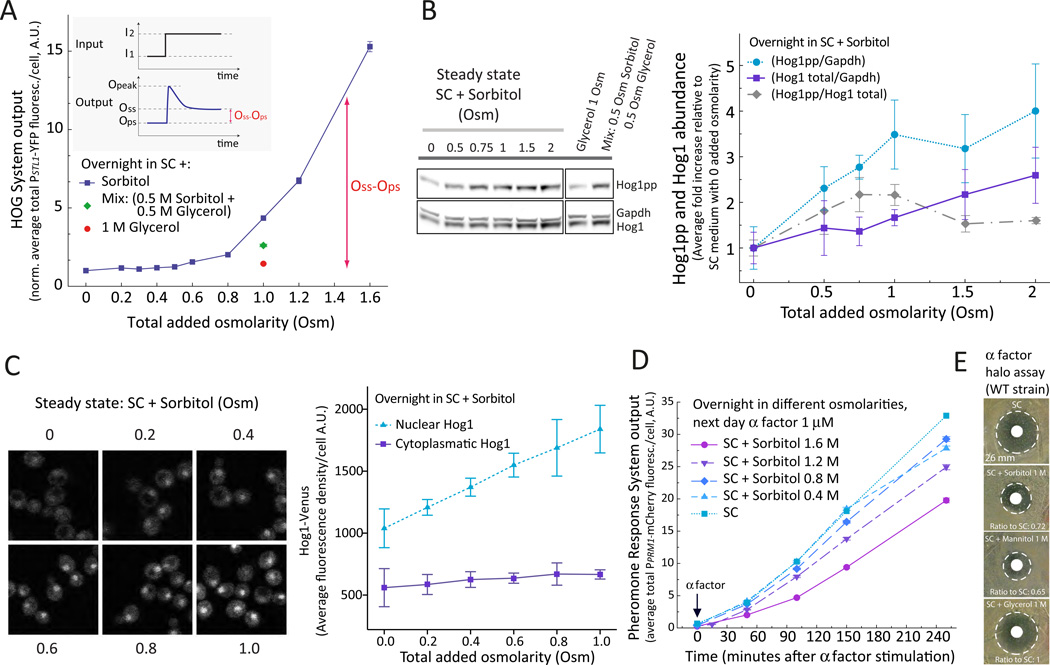
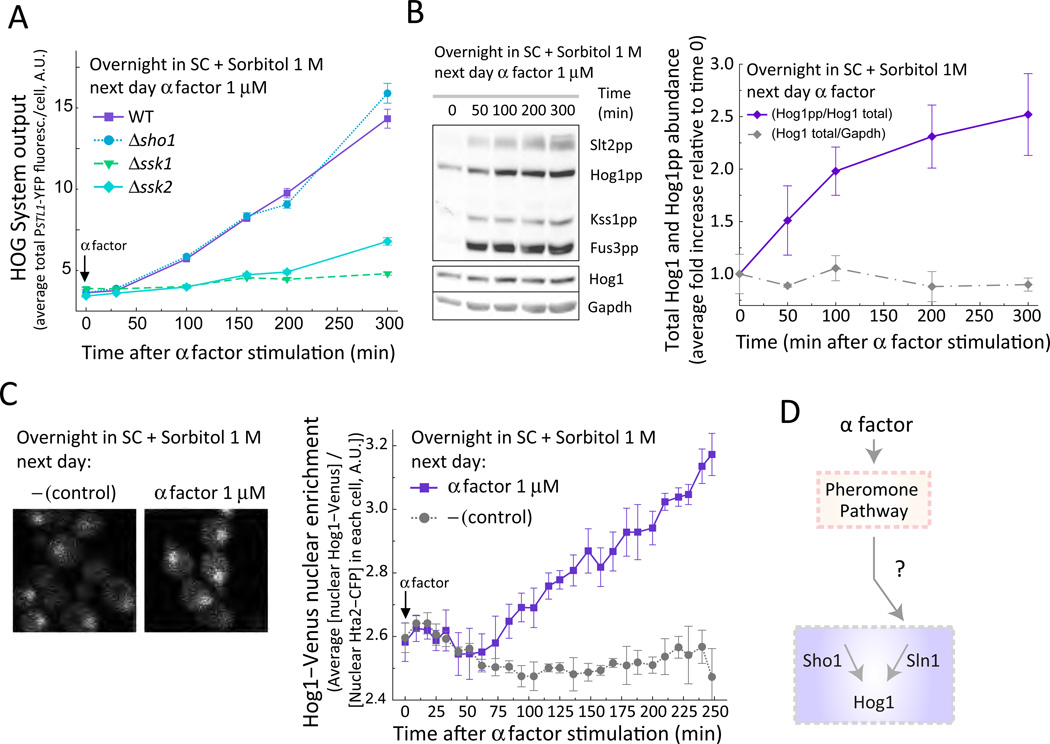
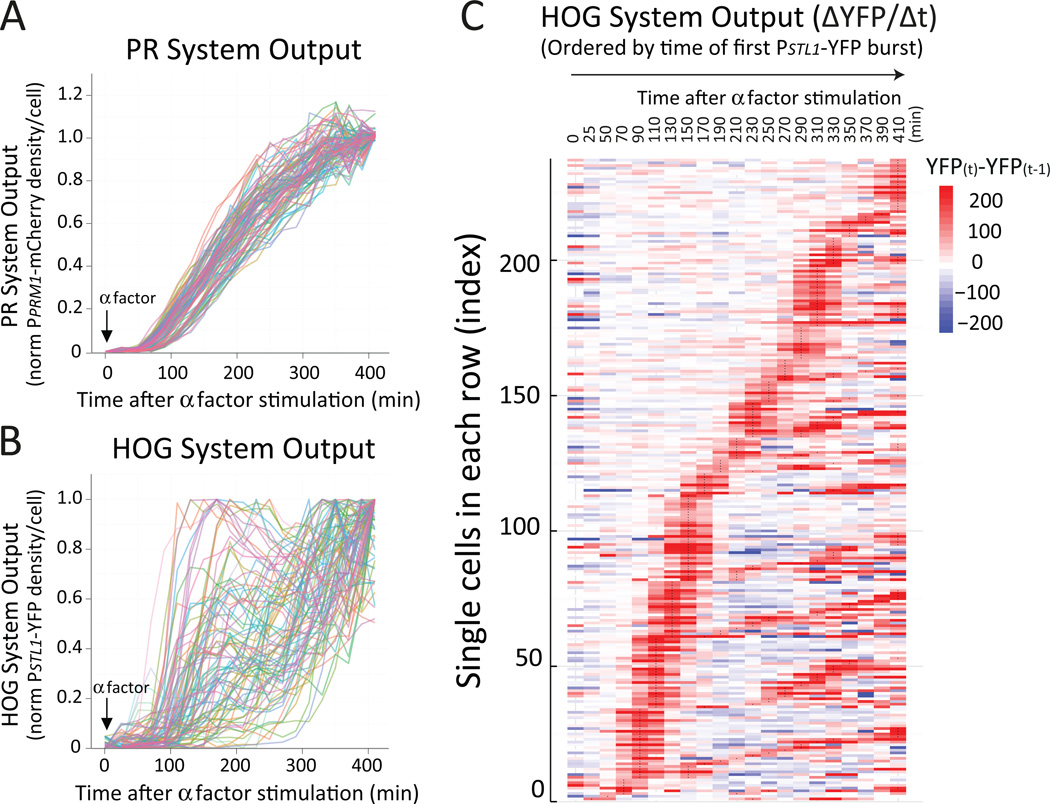
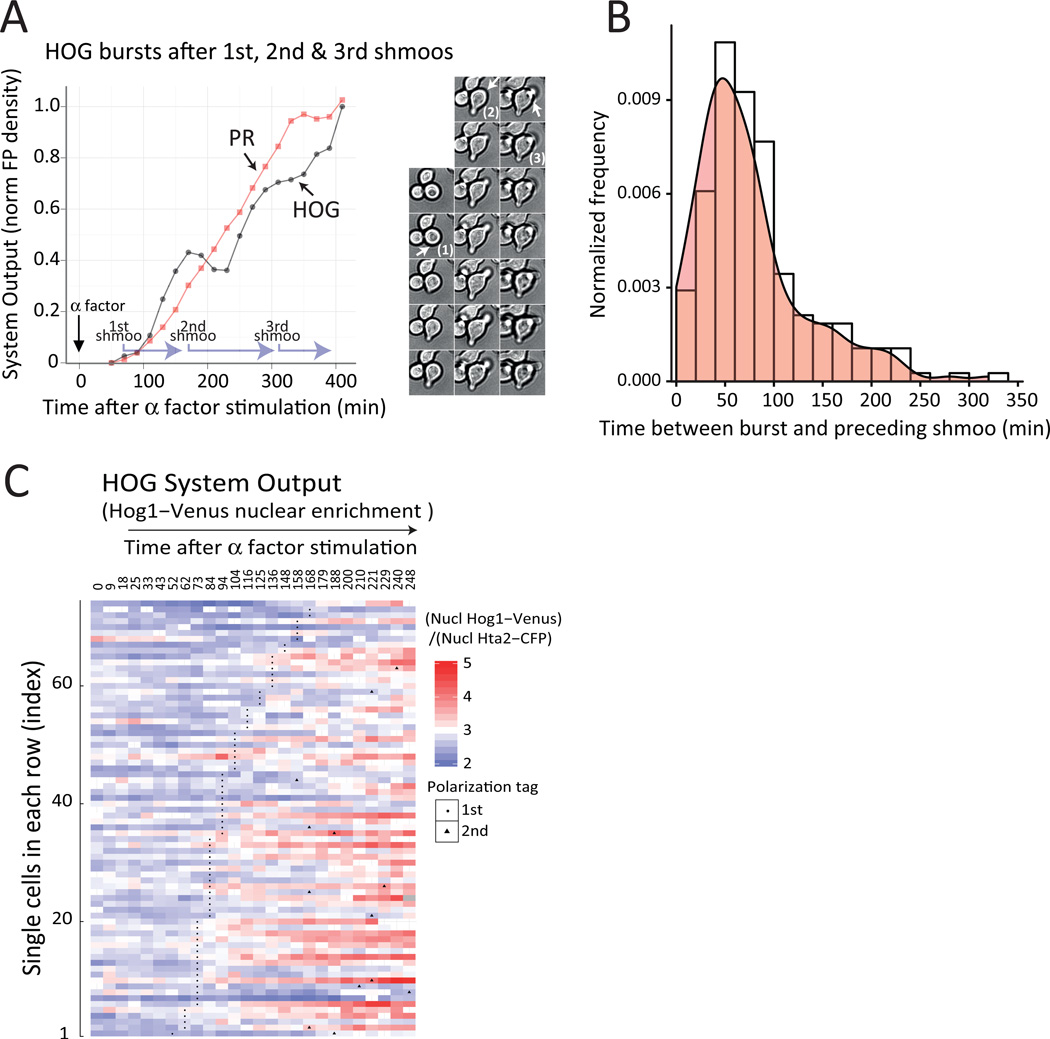
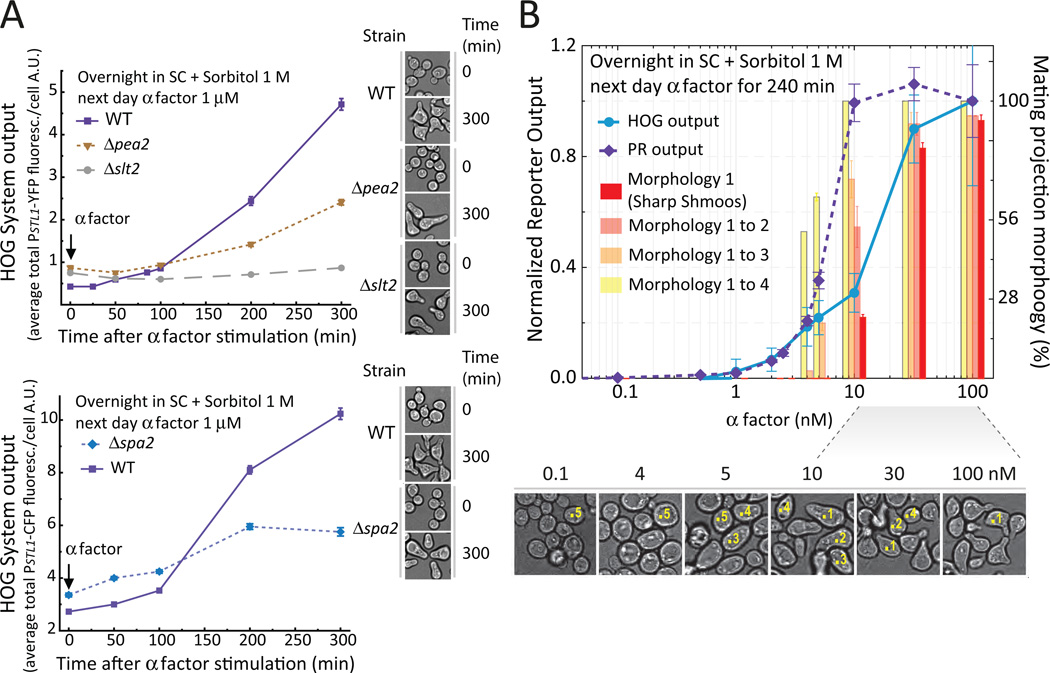
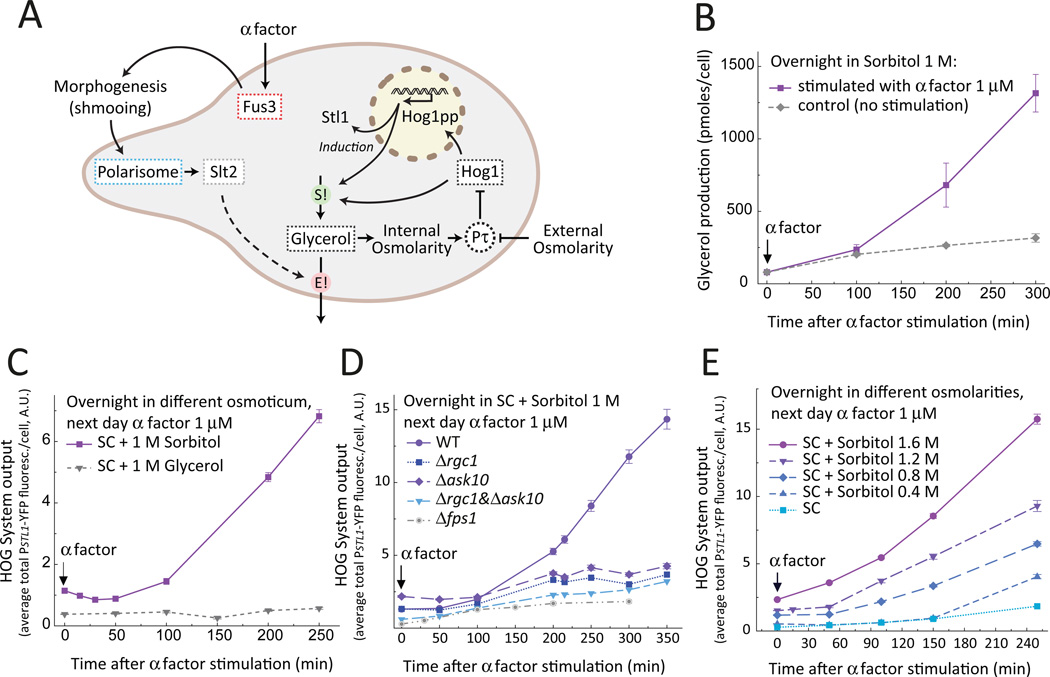
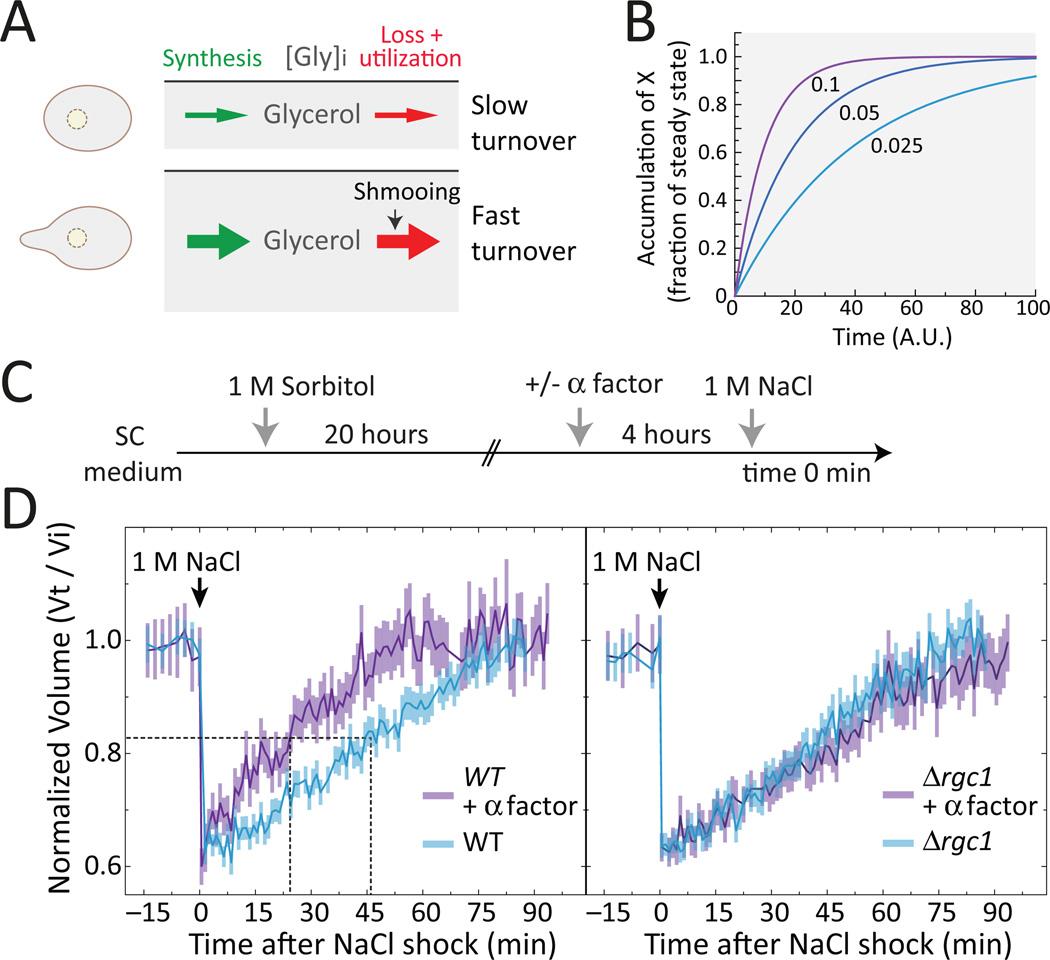
Environmental and internal conditions expose cells to a multiplicity of stimuli whose consequences are difficult to predict. We investigate the response to mating pheromone of yeast cells adapted to high osmolarity. Events downstream of pheromone binding involve two mitogen-activated protein kinase (MAPK) cascades: the pheromone response (PR) and the cell wall integrity (CWI) response. Although the PR MAPK pathway shares components with a third MAPK pathway, the high osmolarity (HOG) response, each one is normally only activated by its cognate stimulus, a phenomenon called insulation. We found that in cells adapted to high osmolarity, PR activated the HOG pathway in a pheromone- and osmolarity-dependent manner. Activation of HOG by the PR was not due to loss of insulation, but rather a response to a reduction in internal osmolarity, which resulted from an increase in glycerol release caused by the PR. By analyzing single-cell time courses, we found that stimulation of HOG occurred in discrete bursts that coincided with the "shmooing" morphogenetic process. Activation required the polarisome, the CWI MAPK Slt2, and the aquaglyceroporin Fps1. HOG activation resulted in high glycerol turnover, which improved adaptability to rapid changes in osmolarity. Our work shows how a differentiation signal can recruit a second, unrelated sensory pathway to fine-tune yeast response in a complex environment.


Figures

Figure 1
Figure 1. A. Schematic representation of the three MAPK pathways relevant for this study
Activation of the pheromone response pathway induces the PPRM1-mCherry transcriptional reporter (left). When phosphorylated and activated Hog1 translocates to the nucleus, it associates with transcription factors like Hot1 to drive the expression of the PSTL1-YFP transcriptional reporter (middle). The CWI MAPK pathway (right). B&C. Single stimulus behavior of the transcriptional reporters used in this study. We stimulated exponentially growing wild-type (LD3342, Δbar1 PPRM1-mCherry PSTL1-YFP PBMH2-CFP) cells with α factor (B) or the indicated concentrations of NaCl (C), and collected samples into cycloheximide at the indicated times for imaging and fluorescent protein quantification. Each input activated only one reporter. Addition of NaCl caused an increase in YFP fluorescence followed by a decline to a lower steady state. Data corresponds to the average total mCherry (B) or YFP (C) fluorescence intensity per cell. Error bars represent the standard error of the mean. (n ∼ 700 cells for each data point). Plots show one representative experiment out of three biological replicates.
Figure 2
Figure 2. Steady state activity of HOG after adaptation is osmolarity dependent
A. HOG transcriptional output. Wild-type (LD3342) cells were adapted over-night to SC (synthetic complete) medium supplemented with sorbitol, glycerol or both osmotica as indicated. Data corresponds to the average total YFP fluorescence intensity per cell normalized to that in SC medium. The HOG adaptive response (inset). I1: Initial external osmolarity, I2: Final external osmolarity. Ops: HOG output pre-shock, Opeak: HOG output at maximum response, Oss: HOG output at steady state post shock. Nomenclature based on Ma et al. (56). Oss – Ops increases with the external osmolarity (p < 1e-4). Error bars represent SEM. n ∼ 700 cells for each data point. B. HOG phosphorylation. LD3342 cells were cultured as in A and protein extracts were analyzed by WB. Representative WB using antibodies against the indicated proteins (left). Quantification of Hog1 phosphorylation in the indicated conditions (right). Data corresponds to the indicated ratios, normalized to values at 0 added Osm (N= 3 experiments). Hog1pp/Gadph and Hog1 total/Gadph increases with external osmolarity (p = 0.016 and 0.03, respectively). Hog1pp/Hog1 total between 0.5 and 1 Osm increases significantly with respect to 0 Osm (α = 0.05, Tukey´s multiple contrasts) C. HOG localization. Wild type yeast (ySP69) expressing Hog1-Venus and Hta2-CFP were cultured as in A and Z-stacks were acquired in a confocal microscope. Montage of cells with in-focus nucleus (left). Quantitification of nuclear and cytoplasmic Hog1-Venus fluorescence intensity at the indicated osmolarity (right). Nuclear Hog1 increases with external osmolarity (76 +/− 4 %/Osm, p < e-4). Cytoplasmic Hog1 slightly increases with osmolarity (20 +/− 6 %/Osm p=0.014). See also Figure S2 and S3. Data corresponds to the mean +/− SEM (N = 3 experiments). D. PR transcriptional output. LD3342 cells were cultured as in A and treated with 1 µM α factor. At the indicated times samples were collected into cycloheximide for imaging and fluorescent protein quantification. Data corresponds to the mean total mCherry fluorescence intensity per cell +/− SEM of one representative experiment (N = 3). n ∼ 700 cells for each data point. The transcription rate of mCherry decreased with external osmolarity (p < 1e-4 for this experiment). E. PR induced cell cycle arrest. Images correspond to halo assays performed with LD3342 yeast on SC plates with the indicated added osmoticum. The doubling time of yeast in these different media was similar: 85.97 +/− 0.74 min (SC with no additions), 93.11 +/− 1.03 min (SC + 1 M sorbitol), 93.37 +/− 3.41 (SC + 1 M glycerol) and 91.00 +/− 3.84 min (SC + 1 M mannitol). See also Fig. S1 to S3.
Figure 3
Figure 3. Mating pheromone activates HOG
A. HOG transcriptional output. Wild-type (LD3342), Δsho1 (RB3704), Δssk1 (RB3382a) and Δssk2 (RB3642) cells adapted to sorbitol were stimulated with α factor and collected into cycloheximide at the indicated time points for imaging. Data corresponds to the mean +/− SEM of the total YFP fluorescence intensity per cell normalized to time zero of one experiment (N = 3 experiments). (n ∼ 700 cells for each data point). YFP fluorescence significantly increased 50 min after pheromone treatment for WT (p < e-4) and Δsho1 (p < e-4), but not for Δssk1 (p = 0.31) or Δssk2 (p = 0.07). B. HOG phosphorylation. Representative WB with protein extracts from LD3342 cells cultured as in A using antibodies against the indicated proteins (left). Quantification of Hog1 phosphorylation in the indicated conditions (right). Data corresponds to the mean +/− SEM of the indicated ratios, normalized to values at time zero (N = 3). Hog1-pp to total Hog1 increases after pheromone treatment (p < e-4). C. HOG localization. Wild-type yeast(ySP69) expressing Hog1-Venus and Hta2-CFP were cultured as in A and imaged in a confocal microscope. Montage showing cells with in-focus nucleus (left). Quantitification of nuclear Hog1-Venus fluorescence localization at the indicated osmolarity (right). Data corresponds to the mean +/− SEM ratio of the ratio of nuclear YFP to CFP signal (N = 3 experiments). Nuclear YFP to CFP ratio increases 50 min after pheromone treatment (p < e-4). D. Model of pheromone-dependent activation of HOG through stimulation of the Sln1 branch. See also Fig. S4 to S7.
Figure 4
Figure 4. Pheromone-dependent activation of HOG occurs in unsynchronized bursts
Wild-type (LD3342) cells were adapted to sorbitol, attached to a glass-bottom 96-well plate and followed under the microscope after pheromone stimulation. PR (A) or HOG (B) transcriptional output in single cells. Each trace corresponds to mCherry (PPRM1-mCherry, A) or YFP (PSTL1-YFP, B) fluorescence intensity over time, normalized to the maximum and minimum values for each cell. C. Heat-map representation of single cell HOG transcriptional output time-course profiles. Cells were ordered (bottom up) based on the time at which they showed their first burst of HOG activity and for those cells with equal burst time of first burst, sorted based on their second burst. ΔYFP/Δt, the time derivative of the YFP fluorescence density. See also Fig. S9 to S11.
Figure 5
Figure 5. Pheromone-dependent activation of HOG correlates with shmooing
A. Time-course (left) of a cell with three bursts of HOG activity, selected from the time courses in Fig. 4 (see also Fig. S10 and S11). Plots show HOG and PR transcriptional output, overlaid with shmooing times (light purple L shaped arrows mark shmooing periods, starting at the time each mating projection is first apparent). Photomontage (right) shows the bright field time-lapse images used to determine the timing of shmooing. Numbers mark shmoos and arrows highlight the position of the nascent mating projection in each cell. Accumulation of the HOG reporter is slightly delayed (about 30 to 40 minutes) from the time of shmooing due to the slow (40 min) maturation of YFP (28). Data corresponds to the fluorescence intensity normalized to the maximum and minimum values. B. Distribution of times between the first frame at which a shmoo was detectable and the time of the peak expression (highest ΔYFP/At) of the subsequent HOG burst. C. Heat-map representation of single cell Hog1-venus nuclear localization time-course profiles from Fig. 3C. Cells were ordered (bottom up) based on the time they show their first shmoo (black dots). Data corresponds to nuclear YFP over CFP signal at each time point, which is significantly higher after shmoo formation than before (p < e-4)
Figure 6
Figure 6. Pheromone-dependent HOG activation requires an intact polarisome and the CWI MAPK Slt2
A. Wild-type (LD3342 or RB3406), Δpea2 (RB3862), Δspa2 (RB3865) and Δslt2 (RB3376a) cells were cultured as in Fig. 3, stimulated with pheromone and collected for imaging in cycloheximide. Data corresponds to the HOG reporter expression average +/− SEM YFP (top) or CFP (bottom) fluorescence intensity per cell over time. HOG reporter expression is reduced in Δpea2 (p < e-4), Δspa2 (p = 0.0097) and Δslt2 (p < e-4) as compared to the correspondent WT strains.Images of each strain at time 0 and 300 min after pheromone stimulation are also shown. Note the typical "peanut" morphology of the polarisome mutants. B. Wild-type (LD3342) cells were cultured as in Fig. 3, stimulated with the indicated pheromone concentrations, and collected for imaging in cycloheximide. Data corresponds to the average +/− SEM YFP (circles) or mCherry (diamonds) normalized to maximum value (left Y axis); or the percentage +/− SD of cells with the different mating projection morphology categories (from 1 to 4), aggregated as indicated (right Y axis). The effective concentration of half maximal response (EC50) for the HOG output differs significantly from the PR output (p < e-4), but not from the fraction of “sharp shmoos” (p = 0.64). Sample bright field images are shown below the plot. Numbers on top of selected cells illustrate the morphology classification used (category 5 corresponds to dividing cells). Note that sharp shmoos (category 1) form only above 10 nM. One representative experiment (N > 3). n ∼ 700 cells for each data point. See also Fig. S12 and S13.
Figure 7
Figure 7. Pheromone activates HOG by stimulating glycerol loss
A. Schematic model of HOG activation by pheromone in cells growing in a high osmolarity environment. Addition of pheromone (or the presence of a mating partner) activates the MAPK Fus3, leading to the mating projection formation (“shmooing”). The machinery involved in shmooing (the polarisome) and cell wall stress activate the CWI pathway and its MAPK Slt2. Activated Fus3 together with Slt2 increase glycerol loss. Intracellular glycerol is required to maintain normal turgor pressure (Pτ). The pheromone-induced loss of glycerol (E!) results in low turgor pressure and in activation of HOG, leading to a compensatory increase in the glycerol synthesis rate (S!) accomplished by HOG activity. B–E. Testing four predictions of the model in A. B. Extracellular accumulation of glycerol. Wild-type (LD3342) cells were cultured overnight in sorbitol and collected at the indicated times from cultures stimulated (squares) or not (diamonds) with pheromone to measure the amount of glycerol in the supernatant. Data corresponds to the average concentration of glycerol in the supernatant divided by the number of cells at each time point (see Figure S15). Bars represent standard deviation (N = 3 independent experiments). Glycerol production is significantly increased in pheromone treated cells (p = 0.0028). C. Replacement of sorbitol by glycerol as extracellular osmoticum. Wild type (LD3342) cells was cultured overnight in sorbitol (squares) or glycerol (triangles), stimulated with pheromone, and samples were collected into cycloheximide at the indicated times to measure reporter expression by microscopy. The HOG reporter was induced in the sorbitol adapted cells (p < e-4), but not in the glycerol adapted ones (p = 0.39). D. Pheromone-mediated HOG activation requires the aquaglyceroporin Fps1. Wild-type (LD3342), Δfps1 (RB3396a), Δrgc1 (RB3710), Δask10 (RB3717) and Δrgc1 Δask10 (RB3722) cells were cultured overnight with 1M sorbitol, stimulated with pheromone and collected into cycloheximide to measure reporter gene expression by microscopy. All mutants had significantly lower HOG reporter transcription than WT cells (p < 1e-4). E. Pheromone-mediated HOG activation increases with increased external osmolarity. Wild-type (LD3342) cells were cultured overnight in the indicated concentrations of sorbitol, stimulated with pheromone and collected into cycloheximide to measure reporter gene expression by microscopy. YFP transcription rate increased with external osmolarity (p < e-4). C–E. Data corresponds to the average YFP fluorescence intensity per cell +/− SEM of one representative experiment. N = 3 experiments in all panels. n ∼ 700 cells for each data point. P-values calculated for the shown data.
Figure 8
Figure 8. Pheromone stimulated cells display improved osmoadaptation
A. Cells maintain an internal glycerol concentration depending on the external osmolarity. In the absence of pheromone, glycerol concentration has a given turnover rate. Pheromone increases the rate of glycerol loss, accelerating its turnover rate. B. The effect of the turnover rate on the dynamics of a putative system in which molecule X is synthesized at a rate β and lost/degraded at a rate a, following the equation dX/dt = β -aX. The plot shows ts the dynamics of this system starting at X = 0, for three different values of β and a (0.1, 0.05 and 0.025 in units of 1/time). The faster the turnover rate, the faster the system reaches steady-state. C. Cells cultured overnight in sorbitol were stimulated with pheromone, then NaCl was added and cell volume was monitored by microscopy. D. Wild-type (LD3342) (left) or Δrgc1 (RB3710) (right) cells. Data corresponds to the average +/− SEM volume normalized to time zero. The horizontal dotted line marks 50% volume recovery. The vertical dotted line marks the time at which this recovery was achieved. Wild-type cells treated with pheromone recover faster than untreated cells (p = 0.0083), but Δrgc1 do not (p = 0.88). See also Fig. S16. N = 3 experiments.

References

    1. Hohmann S. Osmotic stress signaling and osmoadaptation in yeasts. Microbiol Mol Biol Rev. 2002;66:300. - PMC - PubMed
    1. Levin DE. Regulation of cell wall biogenesis in Saccharomyces cerevisiae: the cell wall integrity signaling pathway. Genetics. 2011;189:1145. - PMC - PubMed
    1. Dohlman HG, Thorner JW. Regulation of G protein-initiated signal transduction in yeast: Paradigms and Principles. Annu.Rev.Biochem. 2001;70:703. - PubMed
    1. Madhani HD, Fink GR. The control of filamentous differentiation and virulence in fungi. Trends Cell Biol. 1998;8:348. - PubMed
    1. Roberts CJ, Nelson B, Marton MJ, Stoughton R, Meyer MR, Bennett HA, He YD, Dai H, Walker WL, Hughes TR, Tyers M, Boone C, Friend SH. Signaling and circuitry of multiple MAPK pathways revealed by a matrix of global gene expression profiles. Science. 2000;287:873. - PubMed

Publication types

MeSH terms

LinkOut - more resources