

Automated algorithm for GI spike burst detection and demonstration of efficacy in ischemic small intestine
- PMID: 23612912
- PMCID: PMC3863806
- DOI: 10.1007/s10439-013-0812-8
Automated algorithm for GI spike burst detection and demonstration of efficacy in ischemic small intestine
Abstract
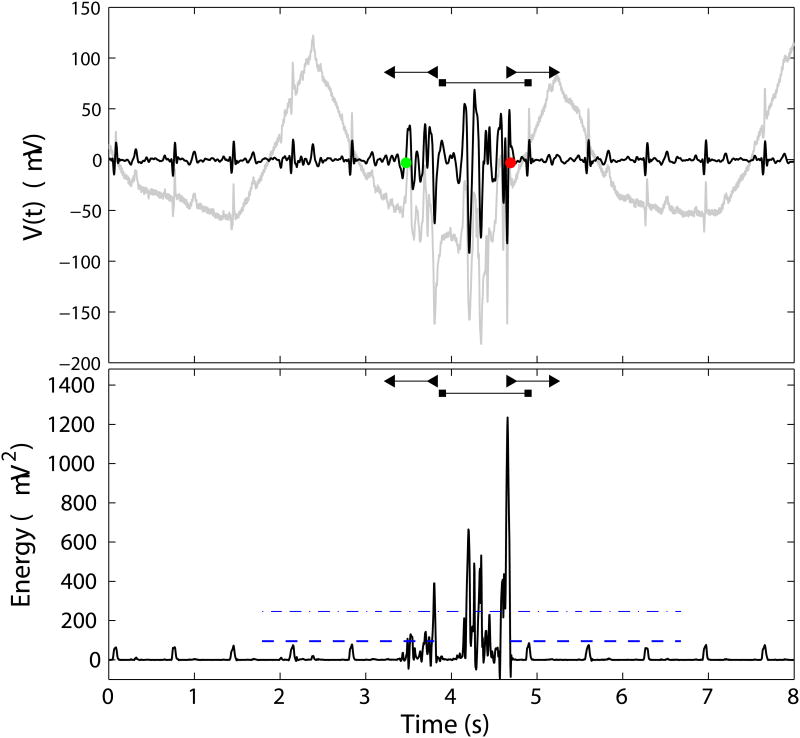
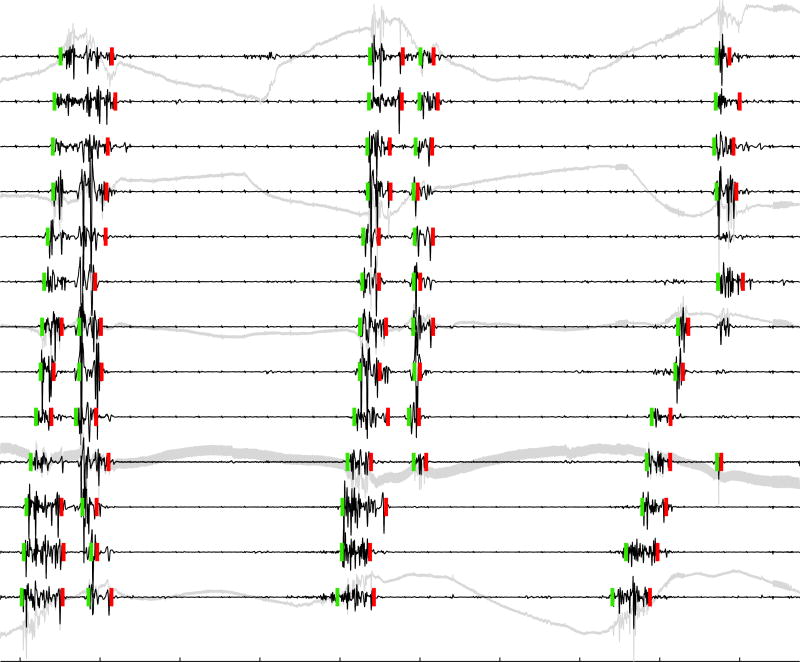
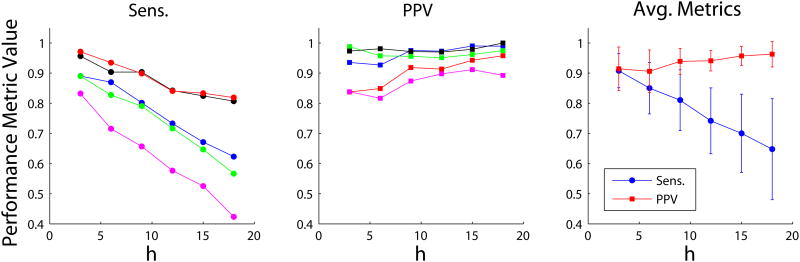
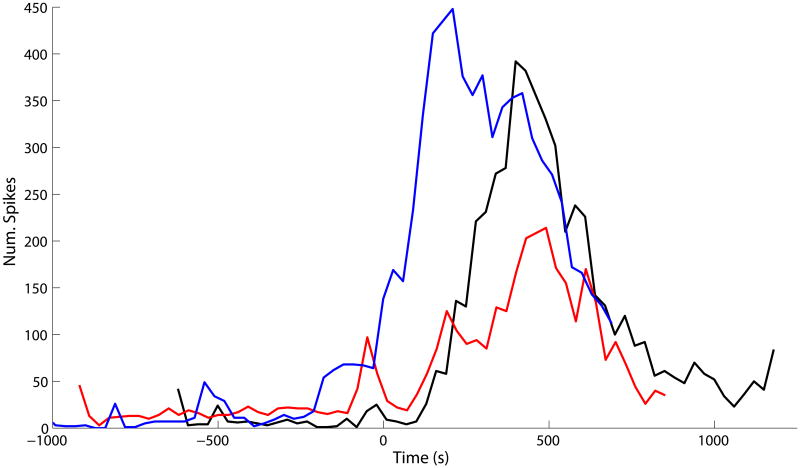
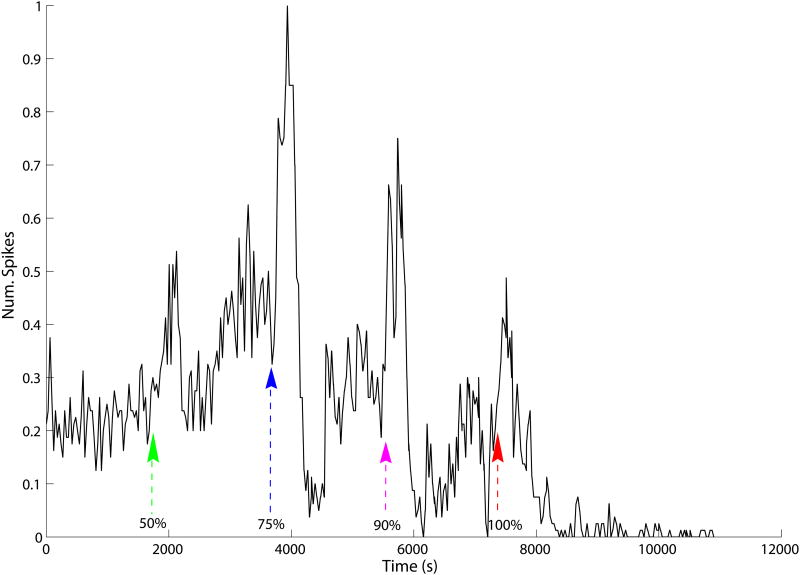
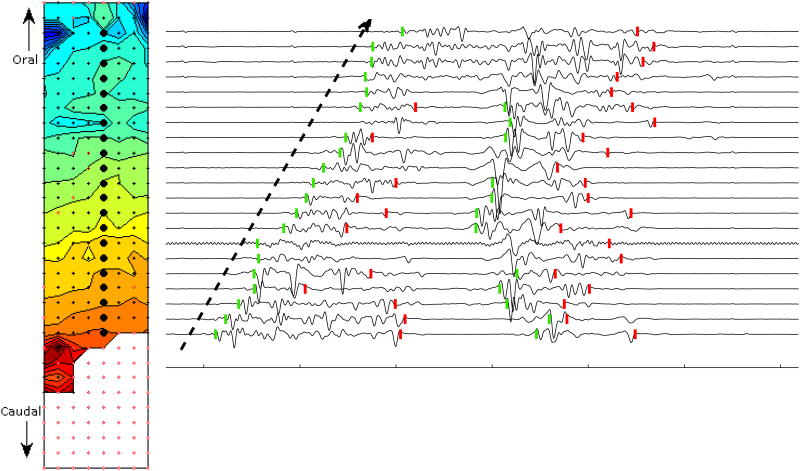
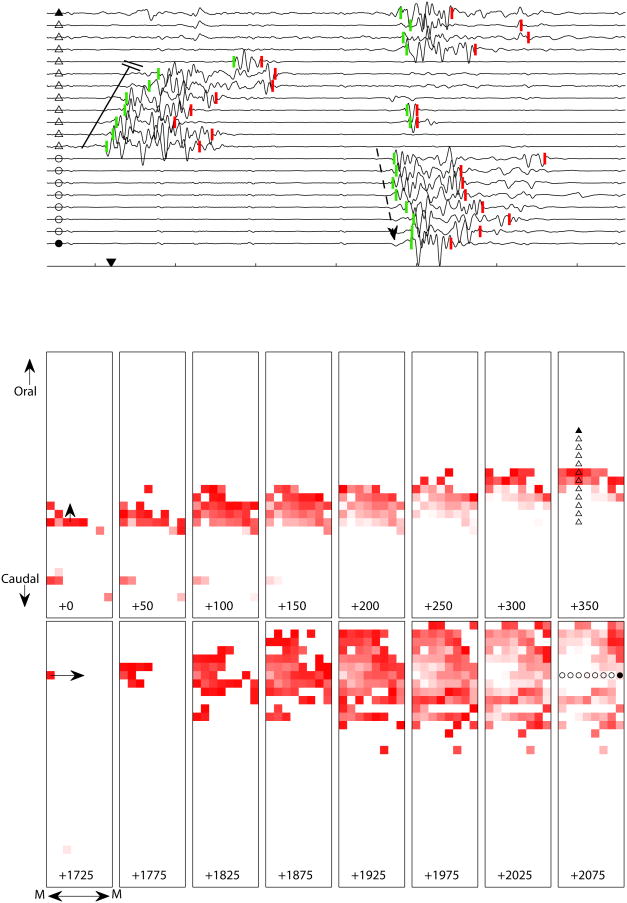
We present a novel, fully-automated gastrointestinal spike burst detection algorithm. Following pre-processing with SALPA (Wagenaar and Potter, J. Neurosci. Methods 120:113-120, 2002) and a Savitzky-Golay filter to remove unwanted low and high frequency components, candidate spike waveforms are detected utilizing the non-linear energy operator. Candidate waveforms are classified as spikes or artifact by a support vector machine. The new method achieves highly satisfactory performance with >90% sensitivity and positive prediction value. We also demonstrate an application of the new method to detect changes in spike rate and spatial propagation patterns upon induction of mesenteric ischemia in the small intestine. Spike rates were observed to transiently increase 10-20 fold for a duration of ≈600 s, relative to baseline conditions. In ischemic conditions, spike activity propagation patterns included retrograde-longitudinal wavefronts with occasional spontaneous conduction blocks, as well as self-terminating concentric-circumferential wavefronts. Longitudinal and circumferential velocities were 6.8-8.0 cm/s and 18.7 cm/s, respectively.
Figures
Similar articles
-
Magnetoenterography for the Detection of Partial Mesenteric Ischemia.J Surg Res. 2019 Jul;239:31-37. doi: 10.1016/j.jss.2019.01.034. Epub 2019 Feb 20. J Surg Res. 2019. PMID: 30782544 Free PMC article.
-
A Framework for Spatiotemporal Analysis of Gastrointestinal Spike Burst Propagation.Annu Int Conf IEEE Eng Med Biol Soc. 2019 Jul;2019:4619-4622. doi: 10.1109/EMBC.2019.8856924. Annu Int Conf IEEE Eng Med Biol Soc. 2019. PMID: 31946893
-
Intestinal tachyarrhythmias during small bowel ischemia.Am J Physiol. 1999 Nov;277(5):G993-9. doi: 10.1152/ajpgi.1999.277.5.G993. Am J Physiol. 1999. PMID: 10564105
-
Normal and abnormal electrical propagation in the small intestine.Acta Physiol (Oxf). 2015 Feb;213(2):349-59. doi: 10.1111/apha.12371. Epub 2014 Sep 18. Acta Physiol (Oxf). 2015. PMID: 25156937 Review.
-
On the pathophysiology of intestinal ischemic injury. Clinical review.Acta Chir Scand. 1987;153(5-6):321-4. Acta Chir Scand. 1987. PMID: 3310486 Review.
Cited by
-
Intraoperative serosal extracellular mapping of the human distal colon: a feasibility study.Biomed Eng Online. 2021 Oct 16;20(1):105. doi: 10.1186/s12938-021-00944-x. Biomed Eng Online. 2021. PMID: 34656127 Free PMC article.
-
High-resolution electrical mapping of porcine gastric slow-wave propagation from the mucosal surface.Neurogastroenterol Motil. 2017 May;29(5):10.1111/nmo.13010. doi: 10.1111/nmo.13010. Epub 2016 Dec 29. Neurogastroenterol Motil. 2017. PMID: 28035728 Free PMC article.
-
Improved Visualization of Gastrointestinal Slow Wave Propagation Using a Novel Wavefront-Orientation Interpolation Technique.IEEE Trans Biomed Eng. 2018 Feb;65(2):319-326. doi: 10.1109/TBME.2017.2764945. IEEE Trans Biomed Eng. 2018. PMID: 29364117 Free PMC article.
-
Iterative Covariance-Based Removal of Time-Synchronous Artifacts: Application to Gastrointestinal Electrical Recordings.IEEE Trans Biomed Eng. 2016 Nov;63(11):2262-2272. doi: 10.1109/TBME.2016.2521764. Epub 2016 Jan 26. IEEE Trans Biomed Eng. 2016. PMID: 26829772 Free PMC article.
-
The advantage of topographic prominence-adopted filter for the detection of short-latency spikes of retinal ganglion cells.Korean J Physiol Pharmacol. 2017 Sep;21(5):555-563. doi: 10.4196/kjpp.2017.21.5.555. Epub 2017 Aug 22. Korean J Physiol Pharmacol. 2017. PMID: 28883759 Free PMC article.
References
-
- Bozler E. The relation of the action potentials to mechanical activity in intestinal muscle. American Journal of Physiology–Legacy Content. 1946;146:496–501. - PubMed
-
- Cabot R, Kohatsu S. The effects of ischemia on the electrical and contractile activities of the canine small intestine. Am J Surg. 1978;136:242–246. - PubMed
-
- Chou C. Relationship between intestinal blood flow and motility. Ann Rev Phys. 1982;44:29–42. - PubMed
Publication types
MeSH terms
Grants and funding
LinkOut - more resources
Full Text Sources
Other Literature Sources
