. 2013 Jun 7;288(23):16926-16936.
doi: 10.1074/jbc.M113.464636. Epub 2013 Apr 23.

Feedback inhibition of deoxy-D-xylulose-5-phosphate synthase regulates the methylerythritol 4-phosphate pathway

Affiliations

Feedback inhibition of deoxy-D-xylulose-5-phosphate synthase regulates the methylerythritol 4-phosphate pathway

Aparajita Banerjee et al. J Biol Chem. .

Abstract

The 2-C-methyl-D-erythritol 4-phosphate (MEP) pathway leads to the biosynthesis of isopentenyl diphosphate (IDP) and dimethylallyl diphosphate (DMADP), the precursors for isoprene and higher isoprenoids. Isoprene has significant effects on atmospheric chemistry, whereas other isoprenoids have diverse roles ranging from various biological processes to applications in commercial uses. Understanding the metabolic regulation of the MEP pathway is important considering the numerous applications of this pathway. The 1-deoxy-D-xylulose-5-phosphate synthase (DXS) enzyme was cloned from Populus trichocarpa, and the recombinant protein (PtDXS) was purified from Escherichia coli. The steady-state kinetic parameters were measured by a coupled enzyme assay. An LC-MS/MS-based assay involving the direct quantification of the end product of the enzymatic reaction, 1-deoxy-D-xylulose 5-phosphate (DXP), was developed. The effect of different metabolites of the MEP pathway on PtDXS activity was tested. PtDXS was inhibited by IDP and DMADP. Both of these metabolites compete with thiamine pyrophosphate for binding with the enzyme. An atomic structural model of PtDXS in complex with thiamine pyrophosphate and Mg(2+) was built by homology modeling and refined by molecular dynamics simulations. The refined structure was used to model the binding of IDP and DMADP and indicated that IDP and DMADP might bind with the enzyme in a manner very similar to the binding of thiamine pyrophosphate. The feedback inhibition of PtDXS by IDP and DMADP constitutes an important mechanism of metabolic regulation of the MEP pathway and indicates that thiamine pyrophosphate-dependent enzymes may often be affected by IDP and DMADP.

Keywords: Deoxyxylulose-5-phosphate Synthase; Enzyme Inhibitors; Enzyme Structure; Isoprene; Isoprenoid; Methylerythritol Pathway; Plant Biochemistry; Thiamine; Thiamine Diphosphate.


Figures

FIGURE 1.
FIGURE 1.
Chromatogram of PtDXS assay mixture at 0 and 5 min. DHAP, DXP, and [13C2] DXP are represented by blue, red, and green, respectively. 13C2-Labeled DXP was used to quantify the amount of DXP produced. The inset shows the composition of the solvents used in the binary gradient for the elution of DXP and DHAP. Solvent A is 50 mm ammonium acetate, pH 10, and solvent B is acetonitrile. cps, counts/s.
FIGURE 2.
FIGURE 2.
pH optimum for PtDXS enzyme. The specific activity of the PtDXS enzyme at different pH values was monitored using LC-MS/MS-based assay. The different pH values of the assay mixture were maintained using Bistris propane buffer. Each data point represents mean, error bars represent S.D. (n = 3). The enzyme is most active at pH 8.0.
FIGURE 3.
FIGURE 3.
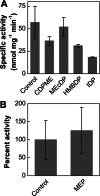
A, effect of different metabolites of the MEP pathway on PtDXS activity based on the LC-MS/MS-based assay. Each bar represents mean, error bars represent S.D. (n = 3). The effect is most significant for IDP (p = 0.0036). B, the effect of MEP on PtDXS activity based on the LC-MS/MS-based assay without using any internal standard. MEP does not have any inhibitory effect on PtDXS activity. CDPME, 4-(cytidine 5′-diphospho)-2-C-methyl-d-erythritol; MEcDP, 2-C-methyl-d-erythritol 2,4-cyclodiphosphate; HMBDP, 4-hydroxy-3-methylbut-2-enyl diphosphate.
FIGURE 4.
FIGURE 4.
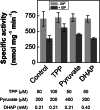
Effect of IDP on PtDXS activity in presence of increased amount of each of the substrates. The light and dark gray bars represent the enzymatic activity in the absence and presence of IDP, respectively. The different categories represent the activity in the presence of twice the amount of a particular substrate (as designated below) compared with that present in the control. Each bar represents mean, error bars represent S.D. (n = 3). Inhibition by IDP is significantly reduced (p < 0.01) in the presence of twice the amount of TPP.
FIGURE 5.
FIGURE 5.
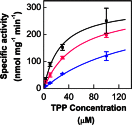
Michaelis-Menten plot for PtDXS activity at different concentrations of TPP and fixed concentration of pyruvate and DHAP in presence of varying concentrations of IDP. Each data point represents mean, error bars represent S.D. (n = 3). Different symbols represent the experimental data points. The solid lines represent the regression of the experimental data points using the method of least squares. Black, pink, and blue represent the PtDXS activity in the presence of 0, 100, and 1000 μm IDP, respectively. PtDXS activity decreases with increasing concentration of IDP.
FIGURE 6.
FIGURE 6.
IC50 curve of DMADP and IDP for the PtDXS enzyme in presence of Km concentration of TPP. Each data point represents mean, error bars represent S.D. (n = 3). The IC50 curves were obtained from the non-linear curve fitting of the experimental data points using Origin. The solid and empty circles represent the experimental data points for IDP and DMADP, respectively, and the solid and dotted lines represent the fitted IC50 curves for IDP and DMADP, respectively. The Ki values of IDP and DMADP were calculated to be ∼65 and ∼81 μm, respectively. The inset shows the effect of sodium pyrophosphate on PtDXS activity. Each bar represents mean, error bars represent S.D. (n = 3). Sodium pyrophosphate did not show any inhibitory effect on PtDXS activity even at a concentration of 1 mm.
FIGURE 7.
FIGURE 7.
A, root mean square fluctuations (RMSF) of Cα atoms of the first subunit of PtDXS during the 1.5-ns production phase of the molecular dynamics simulation. B, structural alignment of PtDXS (green) with EcDXS (yellow) and DrDXS (pink). The ligand binding site of PtDXS is shown in red contour.
FIGURE 8.
FIGURE 8.
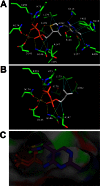
Interactions of PtDXS with the coenzyme TPP (A) and IDP (B) are shown. The Mg2+ ion is shown as a gray sphere. Mg2+ coordination and hydrogen bonds are shown in yellow dashed lines, and van der Waals interactions are shown in cyan dashed lines. Two Mg2+-coordinated water molecules are also shown. C, simulated binding pose of IDP (carbon in green) in the PtDXS active site as compared with that of TPP. The Mg2+ ion is shown as a gray sphere. Two Mg2+-coordinated water molecules are also shown.

References

    1. Wanke M., Skorupinska-Tudek K., Swiezewska E. (2001) Isoprenoid biosynthesis via 1-deoxy-D-xylulose 5-phosphate/2-C-methyl-D-erythritol 4-phosphate (DOXP/MEP) pathway. Acta Biochim. Pol. 48, 663–672 - PubMed
    1. Hunter W. N. (2007) The non-mevalonate pathway of isoprenoid precursor biosynthesis. J. Biol. Chem. 282, 21573–21577 - PubMed
    1. Phillips M. A., León P., Boronat A., Rodríguez-Concepción M. (2008) The plastidial MEP pathway: unified nomenclature and resources. Trends Plant Sci. 13, 619–623 - PubMed
    1. Hemmerlin A., Hoeffler J. F., Meyer O., Tritsch D., Kagan I. A., Grosdemange-Billiard C., Rohmer M., Bach T. J. (2003) Cross-talk between the cytosolic mevalonate and the plastidial methylerythritol phosphate pathways in tobacco bright yellow-2 cells. J. Biol. Chem. 278, 26666–26676 - PubMed
    1. Sacchettini J. C., Poulter C. D. (1997) Creating isoprenoid diversity. Science 277, 1788–1789 - PubMed

Publication types

MeSH terms