. 2013 Jun 7;288(23):16212-16224.
doi: 10.1074/jbc.M112.435149. Epub 2013 Apr 23.

Down-regulation of wild-type p53-induced phosphatase 1 (Wip1) plays a critical role in regulating several p53-dependent functions in premature senescent tumor cells

Affiliations

Down-regulation of wild-type p53-induced phosphatase 1 (Wip1) plays a critical role in regulating several p53-dependent functions in premature senescent tumor cells

Elvira Crescenzi et al. J Biol Chem. .

Abstract

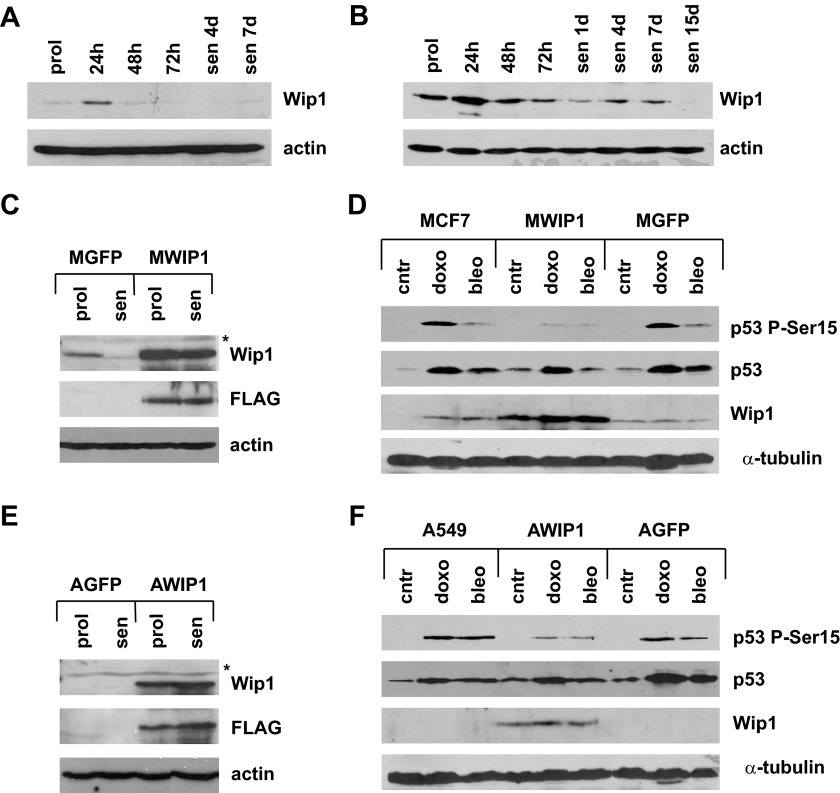
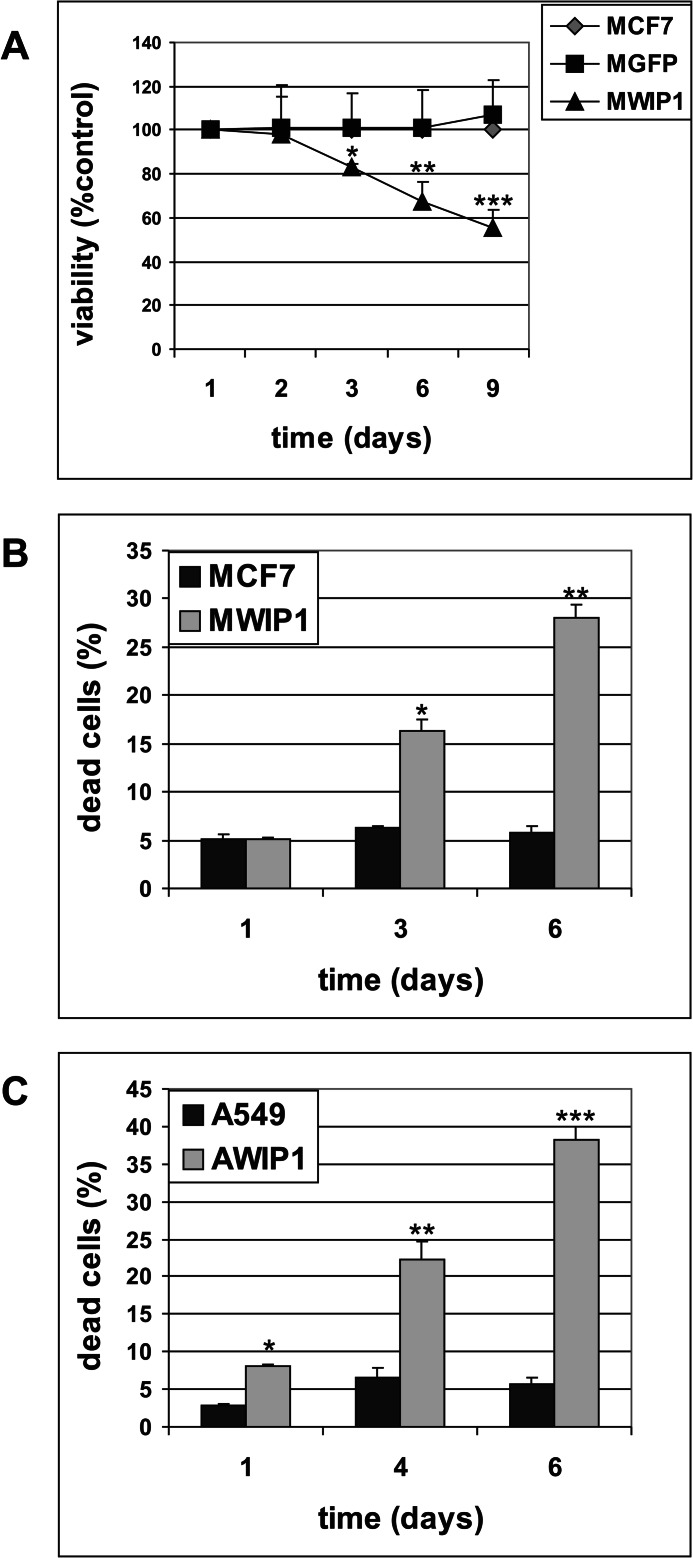
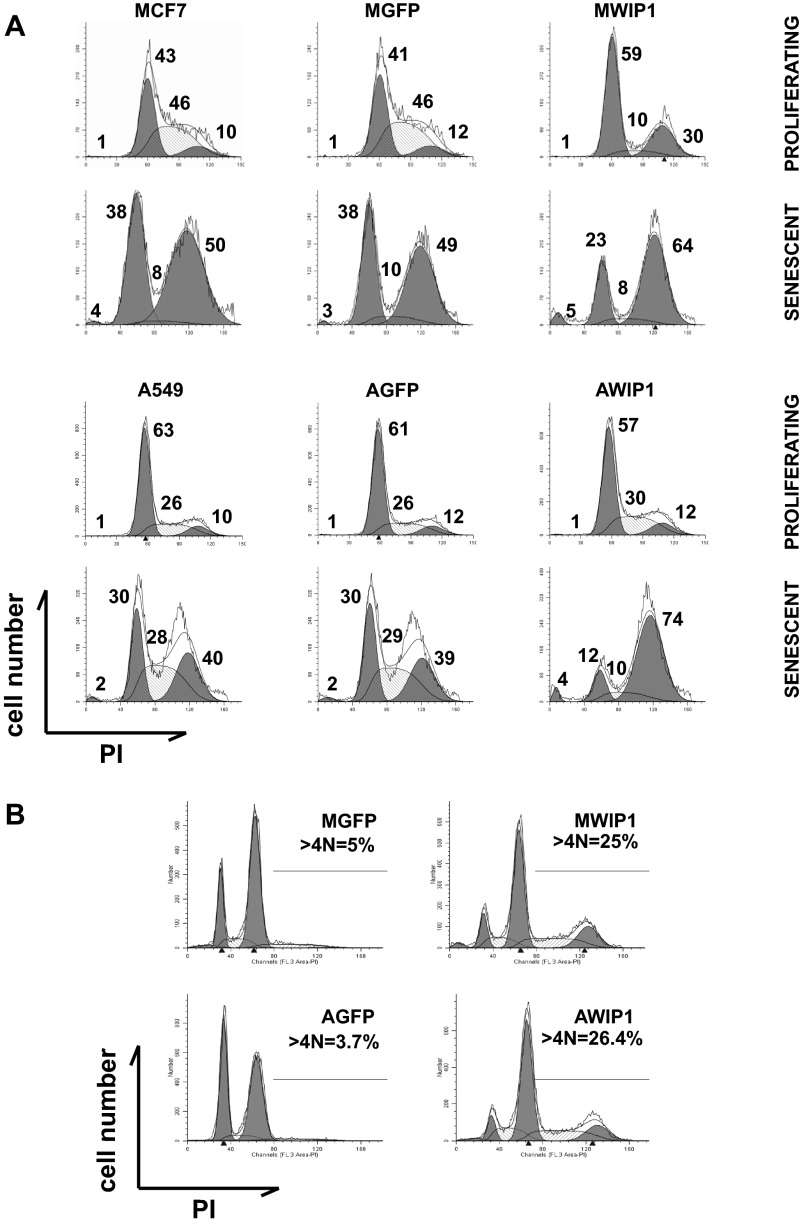
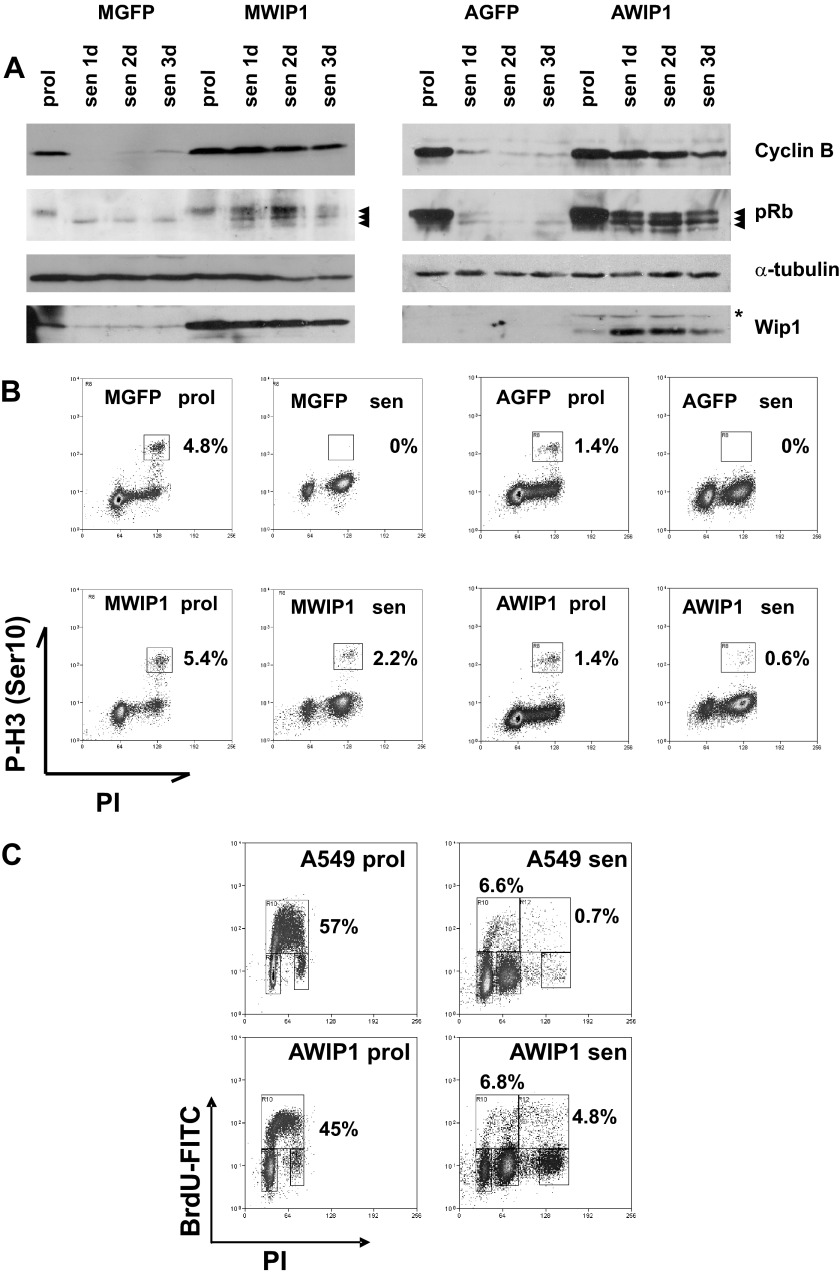
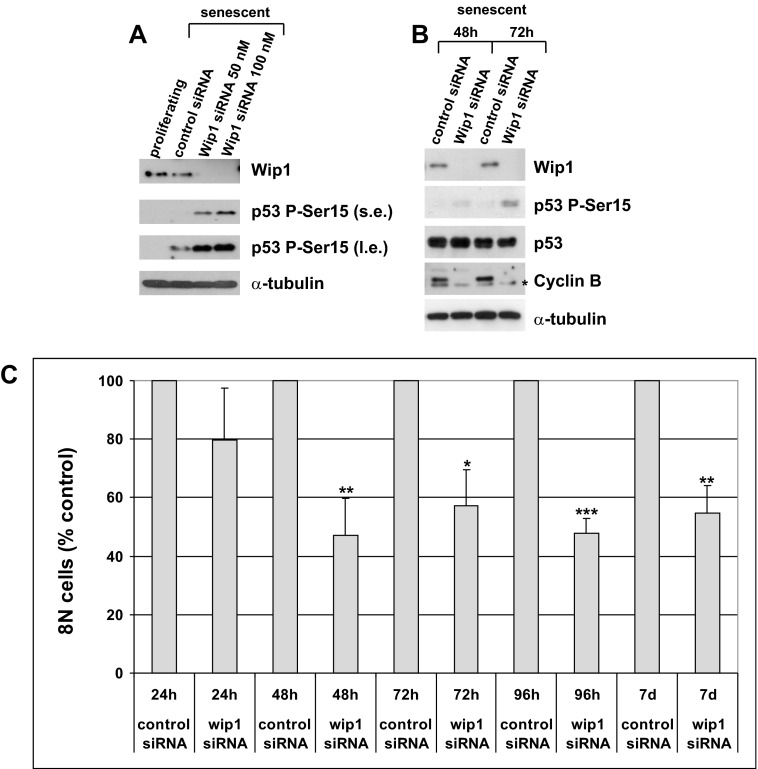
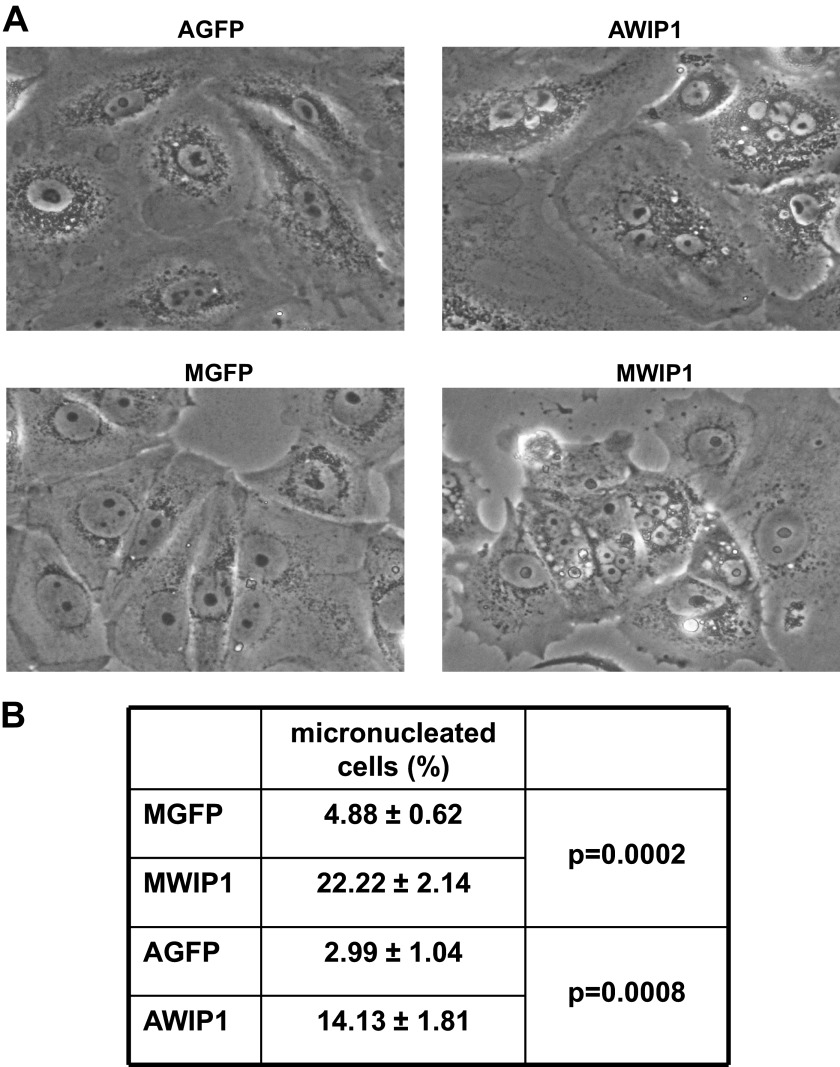
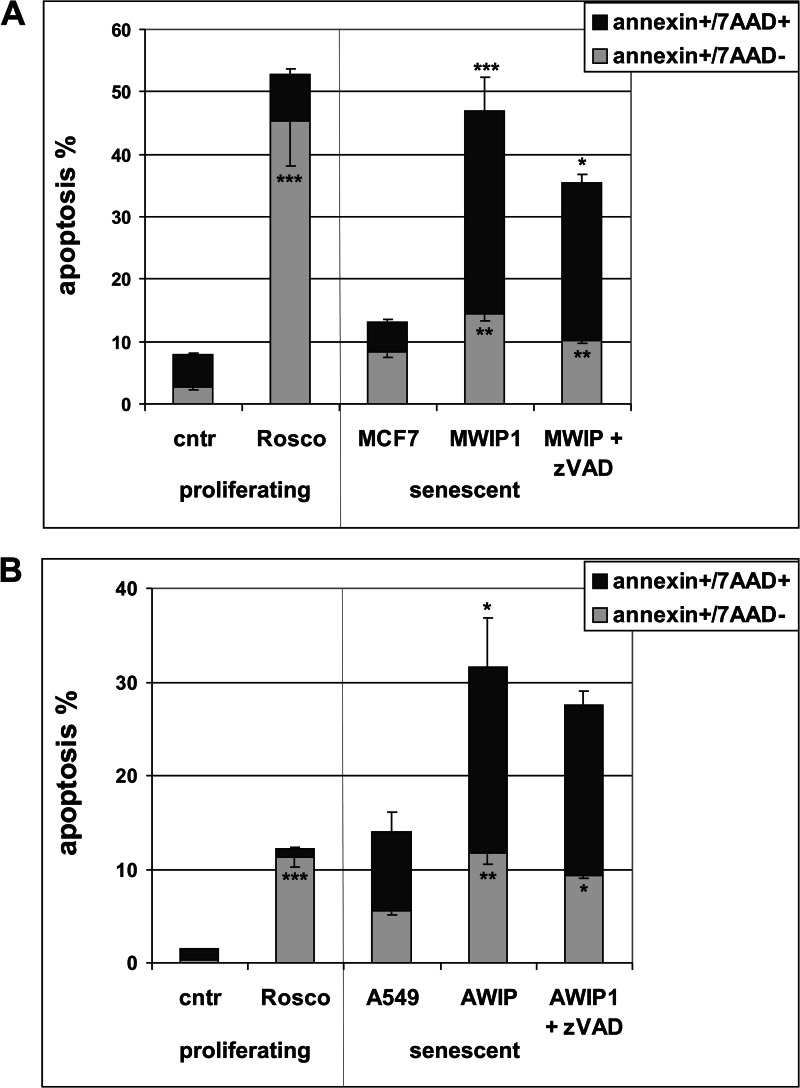
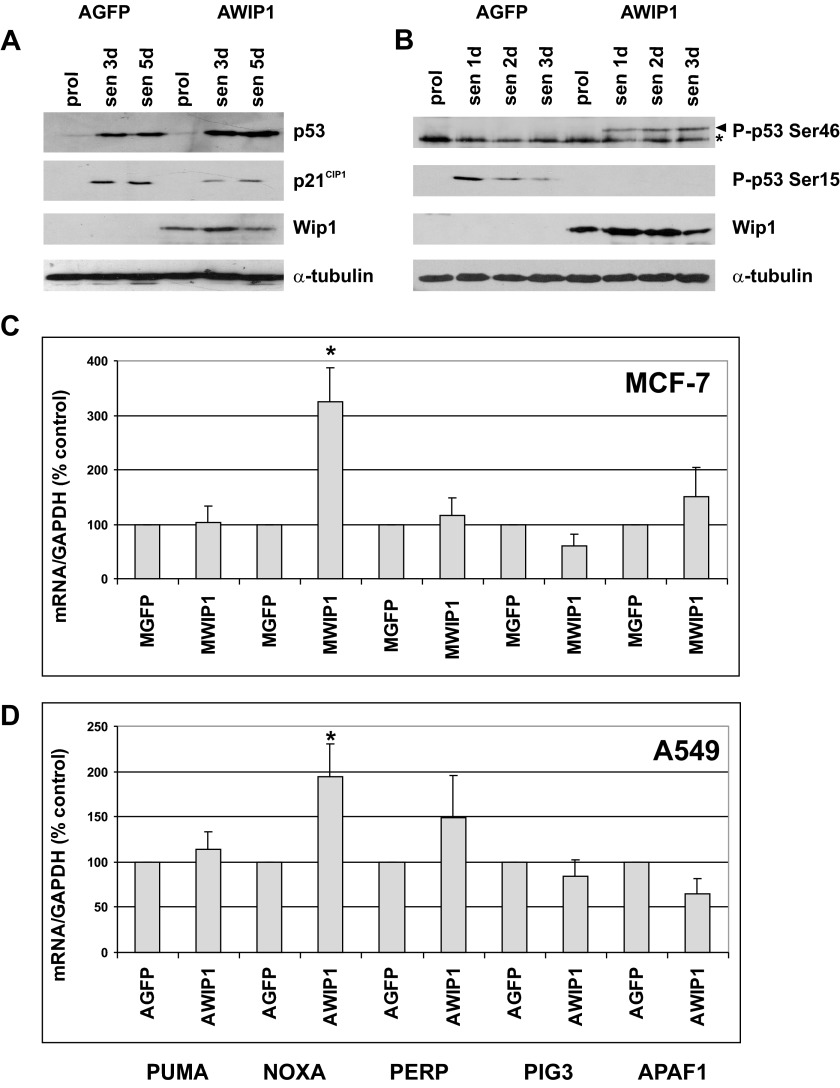
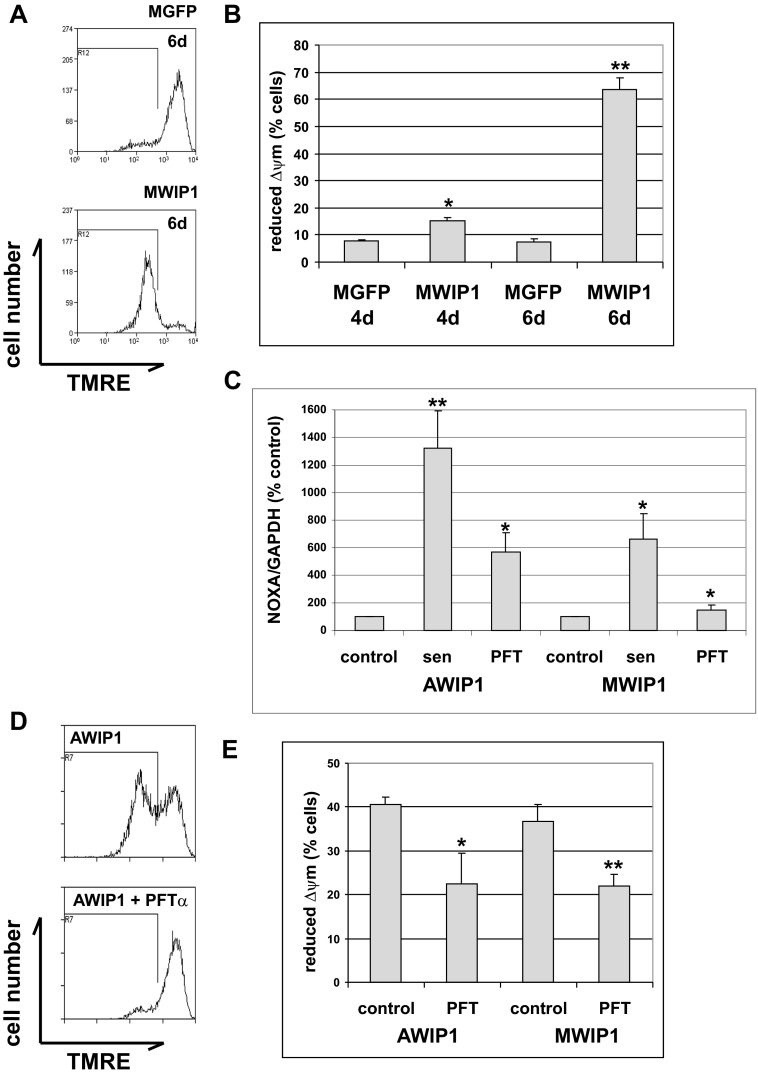
Premature or drug-induced senescence is a major cellular response to chemotherapy in solid tumors. The senescent phenotype develops slowly and is associated with chronic DNA damage response. We found that expression of wild-type p53-induced phosphatase 1 (Wip1) is markedly down-regulated during persistent DNA damage and after drug release during the acquisition of the senescent phenotype in carcinoma cells. We demonstrate that down-regulation of Wip1 is required for maintenance of permanent G2 arrest. In fact, we show that forced expression of Wip1 in premature senescent tumor cells induces inappropriate re-initiation of mitosis, uncontrolled polyploid progression, and cell death by mitotic failure. Most of the effects of Wip1 may be attributed to its ability to dephosphorylate p53 at Ser(15) and to inhibit DNA damage response. However, we also uncover a regulatory pathway whereby suppression of p53 Ser(15) phosphorylation is associated with enhanced phosphorylation at Ser(46), increased p53 protein levels, and induction of Noxa expression. On the whole, our data indicate that down-regulation of Wip1 expression during premature senescence plays a pivotal role in regulating several p53-dependent aspects of the senescent phenotype.

Keywords: Cancer; Cell Death; Cellular Senescence; DNA Damage Response; Polyploidy; Wip1; p53.


Figures

FIGURE 1.
FIGURE 1.
Expression of Wip1 in senescent tumor cells. A, A549 cells were treated with 200 nm doxorubicin for 72 h, extensively washed, and replated in drug-free media. Expression of Wip1 protein was analyzed at indicated time points during drug treatment and during the development of the senescent phenotype. Filters were stripped and reprobed with anti-actin antibody as a loading control. B, MCF7 cells were treated with 200 nm doxorubicin for 72 h, extensively washed, and replated in drug-free media. Expression of Wip1 protein was analyzed at the indicated time points during drug treatment and during the development of the senescent phenotype. Filters were stripped and reprobed with anti-actin antibody as a loading control. C, shown is expression of Wip1 protein in proliferating and senescent MCF7 cells transduced with GFP or FLAG-Wip1. Filters were stripped and reprobed with anti-actin antibody as a loading control. * indicates a nonspecific cross-reactive band. D, MCF7, MWIP1, and MGFP cells were treated with either doxorubicin (1 μm, 2 h) or with bleomycin (20 μg/ml, 2 h), and phosphorylation of p53 at Ser15 was analyzed by Western blot. Filters were stripped and reprobed with anti-p53 and anti-Wip1 antibodies. α-Tubulin was used as a loading control. E, shown is expression of Wip1 protein in proliferating and senescent A549 cells transduced with GFP or FLAG-Wip1. Filters were stripped and reprobed with anti-actin antibody as a loading control. * indicates a nonspecific cross-reactive band. F, A549, AWIP1, and AGFP cells were treated with either doxorubicin (doxo, 1 μm, 2 h) or with bleomycin (bleo, 20 μg/ml, 2 h), and phosphorylation of p53 at Ser15 was analyzed by Western blot. Filters were stripped and reprobed with anti-p53 and anti-Wip1 antibodies. α-Tubulin was used as a loading control. prol, proliferating cells; sen, senescent cells.
FIGURE 2.
FIGURE 2.
Effects of forced Wip1 expression on senescent carcinoma cells. A, MCF7, MWIP1, and MGFP cells were induced to undergo senescence. Cell viability was analyzed by MTS assay at indicated time points during the development of the senescent phenotype. Data are the mean ± S.E. from three independent experiments. Statistical analysis was by unpaired Student's t test: *, p ≤ 0.04; **, p ≤ 0.008; ***, p ≤ 0.0006. B, MCF7 and MWIP1 cells were induced to undergo senescence. Cell death was analyzed by live/dead assay at indicated time points. Data are the mean ± S.E. from three independent experiments. Statistical analysis was by unpaired Student's t test: *, p ≤ 0.0002; **, p ≤ 0.0001. C, A549 and AWIP1 cells were induced to undergo senescence. Cell death was analyzed by live/dead assay at the indicated time points. Data are the mean ± S.E. from three independent experiments. Statistical analysis was by unpaired Student's t test: *, p ≤ 0.001; **, p ≤ 0.0006; ***, p ≤ 0.0001.
FIGURE 3.
FIGURE 3.
Cell cycle distribution in senescent carcinoma cells. A, shown are representative flow cytometric data. Cell cycle distribution in proliferating and senescent cells (4 days after release) was analyzed by flow cytometry after propidium iodide (PI) staining. The percentage of cells in G1, S, G2/M, or sub-G1 phase is given. B, shown are representative flow cytometric data. Senescent cells (4 days after release) were stained with propidium iodide and analyzed by flow cytometry. The percentage of cells with >4N DNA content is given.
FIGURE 4.
FIGURE 4.
Effects of forced Wip1 expression on cell cycle and cell cycle regulators. A, cells were induced to undergo senescence. Cyclin B protein levels were analyzed in proliferating and senescent cells at the indicated time points. pRb phosphorylation was analyzed using a pan-pRb antibody. Arrowheads indicate hyperphosphorylated and hypophosphorylated isoforms of pRb. α-Tubulin was used as a loading control. Filters were stripped and reprobed with anti-Wip1 antibodies. * indicates nonspecific cross-reactive band. B, representative flow cytometric data are shown. Proliferating and senescent cells (3 days after release) were stained with propidium iodide (PI) and phosphorylated histone H3 (Ser10). The percentage of phospho-histone H3 positive cells is given. C, shown are representative flow cytometric data. Proliferating and senescent (4 days after release) A549 and AWIP1 cells were incubated with BrdU for 1 h. The number of BrdU-labeled cells was determined, and the percentage is shown in the chart. prol, proliferating cells; sen, senescent cells.
FIGURE 5.
FIGURE 5.
Effects of Wip1 silencing on cell cycle regulators and polyploidy. A, MCF7 cells were treated with 200 nm doxorubicin for 72 h, extensively washed, and released in drug-free media. Cells were transfected with either control siRNA (50 nm) or with Wip1 siRNA (50 or 100 nm). Expression of Wip1 protein was analyzed after 72 h. Filters were stripped and reprobed with anti-phospho-Ser15 p53 (s.e., short exposure; l.e., long exposure). α-Tubulin was used as a loading control. B, MCF7 cells were treated with 200 nm doxorubicin for 72 h, extensively washed, and released in drug-free media. Cells were transfected with either control siRNA or with Wip1 siRNA (50 nm each). Expression of Wip1 protein was analyzed at 48 h or 72 h after transfection. Filters were stripped and reprobed with anti-phospho-Ser15 p53, anti-p53, and anti-cyclin B1 antibodies. * indicates nonspecific cross-reactive band. α-Tubulin was used as a loading control. C, MCF7 cells were treated with 200 nm doxorubicin for 72 h, extensively washed, and released in drug-free media. Cells were transfected with either control siRNA or with Wip1 siRNA (50 nm each). Senescent cells were stained with propidium iodide and analyzed by flow cytometry at the indicated time points after transfection. Data represent the percentage of cells with 8N DNA content as compared with controls. Data are the mean ± S.E. from three independent experiments. Statistical analysis was by unpaired Student's t test: *, p ≤ 0.03; **, p ≤ 0.005; ***, p ≤ 0.0001.
FIGURE 6.
FIGURE 6.
Morphological markers of mitotic catastrophe in Wip1-expressing premature senescent tumor cells. A, shown is microscopic analysis of senescent AGFP, AWIP1, MGFP and MWIP1cells. Micronuclei formation was determined by phase contrast microscopy 5 days after release. B, fractions of micronucleated cells were determined by scoring at least 300 cells in each sample. The average percentage of micronucleated cells was calculated. Data are the mean ± S.E. from three independent experiments. Statistical analysis was by unpaired Student's t test.
FIGURE 7.
FIGURE 7.
Effects of forced Wip1 expression on cell death. A, shown is flow cytometric analysis of annexin-V/7AAD staining in senescent MCF7 and MWIP1 cells 6 days after release. The percentage of early apoptotic (annexinV+/7AAD−) and late apoptotic/necrotic (annexin V+/7AAD+) cells was determined, and the percentage is shown. Where indicated, cells were incubated with 40 μm z-VAD-FMK for 24 h. Proliferating MCF7 cells were induced to undergo senescence by treatment with 20 μm roscovitine (Rosco) for 24 h and were used as positive control. Data are the mean ± S.E. from three independent experiments. Statistical analysis was by unpaired Student's t test: *, p ≤ 0.02; **, p ≤ 0.002; ***, p ≤ 0.0008. B, shown is flow cytometric analysis of annexin-V/7AAD staining in senescent A549 and AWIP1 cells 6 days after release. The percentage of early apoptotic (annexin V+/7AAD−) and late apoptotic/necrotic (annexin V+/7AAD+) cells was determined, and the percentage is shown. Where indicated, cells were incubated with 40 μm z-VAD-FMK for 24 h. Proliferating A549 cells were induced to undergo senescence by treatment with 20 μm roscovitine for 24 h and were used as the positive control. Data are the mean ± S.E. from three independent experiments. Statistical analysis was by unpaired Student's t test: *, p ≤ 0.03; **, p ≤ 0.001; ***, p ≤ 0.0008.
FIGURE 8.
FIGURE 8.
Effects of forced Wip1 expression on p53, p21CIP1, and on pro-apoptotic genes. A, AGFP and AWIP1 cells were induced to undergo senescence. p53 and p21CIP1 protein levels were analyzed at the indicated time points. Filters were stripped and reprobed with anti-Wip1 antibodies. α-Tubulin was used as a loading control. B, AGFP and AWIP1 cells were induced to undergo senescence. Phosphorylation of p53 at Ser46 and Ser15 was analyzed by Western blot at the indicated time points. Filters were stripped and reprobed with anti-α-tubulin antibodies as a loading control. * indicates nonspecific cross-reactive band. C, real-time PCR analysis of pro-apoptotic genes in senescent MGFP and MWIP1 cells 5 days after release. Data are the mean ± S.E. of three independent experiments. Statistical analysis was by unpaired Student's t test: *, p ≤ 0.05. D, shown is real-time PCR analysis of pro-apoptotic genes in senescent AGFP and AWIP1 cells 5 days after release. Data are the mean ± S.E. of three independent experiments. Statistical analysis was by unpaired Student's t test. *, p ≤ 0.02. prol, proliferating cells; sen, senescent cells.
FIGURE 9.
FIGURE 9.
Effects of forced Wip1 expression on mitochondrial depolarization. A, shown is representative flow cytometric analysis of senescent MGFP and MWIP1 cells stained with TMRE. B, MGFP and MWIP1 cells were induced to undergo senescence. The percentage of cells with reduced ΔΨm was estimated by TMRE staining at the indicated time points. Data are the mean ± S.D. of three independent experiments. Statistical analysis was by unpaired Student's t test: *, p ≤ 0.001; **, p ≤ 0.0001. C, shown is real-time PCR analysis of Noxa. Three days after release senescent AWIP1 and MWIP1 cells were treated with 20 μm PFT-α for 48 h. Data are the mean ± S.E. of three independent experiments. Statistical analysis was by unpaired Student's t test: *, p ≤ 0.005; **, p ≤ 0.0008. D, shown is representative flow cytometric analysis of senescent AWIP1 cells treated with 20 μm PFT-α for 48 h. E, 3 days after release, senescent AWIP1 and MWIP1 cells were treated with 20 μm PFT-α for 48 h. The percentage of cells with reduced ΔΨm was estimated by TMRE staining. Data are the mean ± S.D. of three independent experiments. Statistical analysis was by unpaired Student's t test. *, p ≤ 0.05; **, p ≤ 0.01. prol, proliferating cells; sen, senescent cells.

Similar articles

Cited by

References

    1. Hayflick L., Moorhead P. S. (1961) The serial cultivation of human diploid cell strains. Exp. Cell Res. 25, 585–621 - PubMed
    1. Kuilman T., Michaloglou C., Mooi W. J., Peeper D. S. (2010) The essence of senescence. Genes Dev. 24, 2463–2479 - PMC - PubMed
    1. Wang Y., Blandino G., Oren M., Givol D. (1998) Induced p53 expression in lung cancer cell line promotes cell senescence and differentially modifies the cytotoxicity of anti-cancer drugs. Oncogene 17, 1923–1930 - PubMed
    1. Wang Y., Blandino G., Givol D. (1999) Induced p21waf expression in H1299 cell line promotes cell senescence and protects against cytotoxic effect of radiation and doxorubicin. Oncogene 18, 2643–2649 - PubMed
    1. Chang B. D., Broude E. V., Dokmanovic M., Zhu H., Ruth A., Xuan Y., Kandel E. S., Lausch E., Christov K., Roninson I. B. (1999) A senescence-like phenotype distinguishes tumor cells that undergo terminal proliferation arrest after exposure to anticancer agents. Cancer Res. 59, 3761–3767 - PubMed

Publication types

MeSH terms

LinkOut - more resources