. 2013 Jun 7;288(23):16960-16974.
doi: 10.1074/jbc.M113.470799. Epub 2013 Apr 23.

NHERF2 protein mobility rate is determined by a unique C-terminal domain that is also necessary for its regulation of NHE3 protein in OK cells

Affiliations

NHERF2 protein mobility rate is determined by a unique C-terminal domain that is also necessary for its regulation of NHE3 protein in OK cells

Jianbo Yang et al. J Biol Chem. .

Abstract

Na(+)/H(+) exchanger regulatory factor (NHERF) proteins are a family of PSD-95/Discs-large/ZO-1 (PDZ)-scaffolding proteins, three of which (NHERFs 1-3) are localized to the brush border in kidney and intestinal epithelial cells. All NHERF proteins are involved in anchoring membrane proteins that contain PDZ recognition motifs to form multiprotein signaling complexes. In contrast to their predicted immobility, NHERF1, NHERF2, and NHERF3 were all shown by fluorescence recovery after photobleaching/confocal microscopy to be surprisingly mobile in the microvilli of the renal proximal tubule OK cell line. Their diffusion coefficients, although different among the three, were all of the same magnitude as that of the transmembrane proteins, suggesting they are all anchored in the microvilli but to different extents. NHERF3 moves faster than NHERF1, and NHERF2 moves the slowest. Several chimeras and mutants of NHERF1 and NHERF2 were made to determine which part of NHERF2 confers the slower mobility rate. Surprisingly, the slower mobility rate of NHERF2 was determined by a unique C-terminal domain, which includes a nonconserved region along with the ezrin, radixin, moesin (ERM) binding domain. Also, this C-terminal domain of NHERF2 determined its greater detergent insolubility and was necessary for the formation of larger multiprotein NHERF2 complexes. In addition, this NHERF2 domain was functionally significant in NHE3 regulation, being necessary for stimulation by lysophosphatidic acid of activity and increased mobility of NHE3, as well as necessary for inhibition of NHE3 activity by calcium ionophore 4-Br-A23187. Thus, multiple functions of NHERF2 require involvement of an additional domain in this protein.

Keywords: Epithelial Cell; Exocytosis; Mobility; Scaffold Proteins; Sodium Proton Exchange; Trafficking.


Figures

FIGURE 1.
FIGURE 1.
mEOS2-NHERFs are localized to the microvilli in OK cells and are mobile. A, top, XY confocal images of mEOS2-NHERFs were taken at the apical surface of OK cells; bottom, XZ images are slices of Z-section. Bar, 5 μm. B, representative images of FRAP experiments. First images on the left are before photo-bleaching. The following images were taken immediately or 15, 30, 45, and 60 s after bleaching. Arrows point to the microvillus cluster being bleached. Bar, 5 μm. C, average recovery curves of mEOS2-NHERF1 (○), mEOS2-NHERF2 (■), and mEOS2-NHERF3 (▴) from 12 cells normalized by total quenched fluorescence intensity. Error bars represent S.D.
FIGURE 2.
FIGURE 2.
Mobile fractions and diffusion coefficients of NHERFs. A, mobile fractions and diffusion coefficients of NHERFs in OK or Caco-2 cells were derived from experiments and listed in the table. Mobile fractions (B) and diffusion coefficients (C) of mEOS2-NHERFs and mCherry-NHERFs were plotted. Experiments were repeated three times, and in each experiment FRAP data from eight different cells were used for the calculation (n = 24, results are mean ± S.D.).
FIGURE 3.
FIGURE 3.
Neither nocodazole nor jasplakinolide significantly affected the mobility of mEOS2-NHERFs in OK cells. FRAP recovery curves of mEOS2-NHERF1 (A and D), mEOS2-NHERF2 (B and E), and mEOS2-NHERF3 (C and F) in the presence of 30 μm nocodazole (A–C) or 3 μm jasplakinolide (D–F) were compared with control conditions without treatment. Cells were incubated with 30 μm nocodazole for 3 h or 3 μm jasplakinolide for 1 h before FRAP experiments. Nocodazole or jasplakinolide treatment is represented by □ and control condition is represented by ●. Error bars represent S.D. One representative result from three repeated pairwise experiments is shown.
FIGURE 4.
FIGURE 4.
Photo-converted mEOS2-NHERFs redistributed homogeneously over the entire apical microvilli in OK cells. The first images on the left show the green fluorescence of mEOS2-NHERFs on the apical membrane of OK cells before photo-conversion. The second images show there is no red signal before photo-conversion. Then a small area of microvillar clusters, marked by the box, was photo-converted from green to red by exposure to UV laser for ∼10–20 s. Movement of the red photo-converted mEOS2-NHERFs was monitored every 30 s. Bar, 5 μm. Experiments were repeated three times, and representative images are shown.
FIGURE 5.
FIGURE 5.
Recovery dynamics of mEOS2-NHERF1 and mEOS2-NHERF2 were independent of PDZ ligand binding. A, fluorescence recovery was compared between wild type mEOS2-NHERF1 (●) and mEOS2-NHERF1-PDZ1/2-GAGA mutant (□), in which PDZ ligand binding groove sequence GYGF were mutated to GAGA in both PDZ domains. B, fluorescence recovery was compared between wild type mEOS2-NHERF2 (●) and mEOS2-NHERF2-PDZ1/2-GAGA mutant (□). Error bars represent S.D. One representative result from three repeated pairwise experiments is shown.
FIGURE 6.
FIGURE 6.
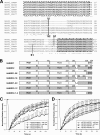
Recovery dynamics of mEOS2-NHERF1 and mEOS2-NHERF2 were determined by their C termini. A, sequence alignment of C-terminal part of NHERF1 and NHERF2. Sequences of NHERF1 and NHERF2 from Homo sapiens, Mus musculus, and Oryctolagus cuniculus were aligned with ClustalW software. Part of PDZ2 domain is framed by dash lines. EBD is framed by dash-dot lines. Lines labeled with S1 are the positions switched to make NHERF1-2E and NHERF2-1E chimeras. Lines labeled with S2 are the positions switched to make NHERF1-2C and NHERF2-1C chimeras. B, domain architectures of wild type NHERF1, NHERF2, and five chimeras. White rectangles represent sequences from NHERF1, and gray rectangles represent sequences from NHERF2. Numbers on the top of the rectangles represent the numbers of the amino acid residues. C, fluorescence recovery was compared among wild type mEOS2-NHERF1 (○), mEOS2-NHERF2 (□), chimera mEOS2-NHERF1-2E (●), and mEOS2-NHERF2-1E (■). The data points of mEOS2-NHERF2 after 20 s are significantly different from that of other constructs (p < 0.05). D, fluorescence recovery was compared among wild type mEOS2-NHERF1 (○), mEOS2-NHERF2 (□), chimera mEOS2-NHERF1-2C (●), and mEOS2-NHERF2-1C (■). The data points of mEOS2-NHERF1 after 15 s are significantly different from that of mEOS2-NHERF1-2C (p < 0.05), and the data points of mEOS2-NHERF2 after 15 s are significantly different from that of mEOS2-NHERF2-1C (p < 0.05). Error bars represent S.D. One representative result from three repeated pairwise experiments is shown.
FIGURE 7.
FIGURE 7.
NHERF1 and NHERF2 do not show significant differences in lipid raft association. OK cells were transiently transfected with pFLAG-NHERF1 and pmEOS2-NHERF2. Total membranes were subjected to lipid raft flotation analysis by sucrose gradient (A) or OptiPrep gradient (B) as described under “Experimental Procedures.” NHERF1 was probed with mouse monoclonal anti-FLAG. NHERF2 was probed with rabbit polyclonal anti-NHERF2. GM1 was analyzed by dot-blotting with Alexa Fluor 790-conjugated cholera toxin. Experiments were repeated three times, and one representative result is shown.
FIGURE 8.
FIGURE 8.
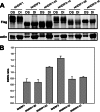
C terminus of NHERF2 also determines the DS and DI distribution. A, total membranes were prepared from OK cells transiently transfected with pFLAG-NHERF1 or NHERF2 constructs and then separated into DS and DI fractions by treating with 0.5% Triton X-100 buffer at 4 °C. All NHERFs were probed with mouse monoclonal anti-FLAG. B, experiments were repeated three times. The intensity of the band was quantitated by densitometry, and the DI/DS ratio was derived from the intensities. Error bars represent S.E.
FIGURE 9.
FIGURE 9.
NHERF proteins carrying the C terminus of NHERF2 were associated with membrane in larger complexes determined by sucrose gradient ultracentrifugation. Total membranes were prepared from OK cells transiently transfected with pmEOS2-NHERF2 and pFLAG-NHERF1 (A), pFLAG-NHERF2 (B), pFLAG-NHERF1 and pFLAG-NHERF1-2C (C), and pFLAG-NHERF2-1C and pFLAG-NHERF2 (D) and then were subjected to complex size analysis as described under “Experimental Procedures.” A, FLAG-NHERF1 was probed with mouse monoclonal anti-FLAG, and mEOS2-NHERF2 was probed with rabbit polyclonal anti-NHERF2. B, NHERF1 was probed with mouse monoclonal anti-NHERF1, and FLAG-NHERF2 was probed with rabbit polyclonal anti-NHERF2 antibodies. C, FLAG-NHERF1 was probed with mouse monoclonal anti-FLAG, and FLAG-NHERF1-2C was probed with rabbit polyclonal anti-NHERF2 (recognizing NHERF2 C terminus). D, FLAG-NHERF2-1C was probed with mouse monoclonal anti-FLAG antibodies, and FLAG-NHERF2 was probed with rabbit polyclonal anti-NHERF2. Experiments were repeated three times, and one representative result is shown.
FIGURE 10.
FIGURE 10.
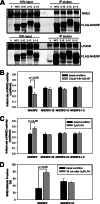
NHERF2 loses the ability to support NHE3 inhibition by calcium ionophore 4-Br-A23187 and stimulation by LPA when its C terminus is substituted with the C terminus of NHERF1. A, NHE3 and LPA5R were co-immunoprecipitated (IP) with FLAG-NHERF2 constructs (pFLAG-NHERF2, pFLAG-NHERF2-1E, pFLAG-NHERF2-1C, or pFLAG-NHERF2-1–2) as described under “Experimental Procedures.” LPA5R and NHE3 are both fused with the HA tag and probed with mouse monoclonal anti-HA. FLAG-NHERF2 was probed with mouse monoclonal anti-FLAG. Empty p3×FLAG-CMV-10 vector (V) was used as control. B, OK cells were transiently co-transfected with pcDNA3.1-HA-NHE3 and NHERF2 constructs as indicated. NHE3 activity was measured in the absence (black bar) and presence (gray bar) of 0.5 μm 4-Br-A23187 (n = 5). C, OK cells were transiently co-transfected with pcDNA3.1-HA-NHE3, pcDNA3.1-LPA5R, and FLAG-NHERF2 constructs as indicated. NHE3 activity was measured in the absence (black bar) and presence (gray bar) of 3 μm LPA (n = 5). D, OK cells were transiently co-transfected with pcDNA3.1-NHE3-GFP, pcDNA3.1-LPA5R, and FLAG-NHERF2 constructs as indicated. NHE3 mobility was measured at basal condition (black bar) and 30 min after the treatment with 3 μm LPA (gray bar) (n = 3). Error bars represent S.E.; results with no p value labeled are not significantly different.

Similar articles

Cited by

References

    1. Lange K. (2011) Fundamental role of microvilli in the main functions of differentiated cells: Outline of an universal regulating and signaling system at the cell periphery. J. Cell. Physiol. 226, 896–927 - PubMed
    1. Brant S. R., Yun C. H., Donowitz M., Tse C. M. (1995) Cloning, tissue distribution, and functional analysis of the human Na+/N+ exchanger isoform, NHE3. Am. J. Physiol. 269, C198–C206 - PubMed
    1. Schultheis P. J., Clarke L. L., Meneton P., Miller M. L., Soleimani M., Gawenis L. R., Riddle T. M., Duffy J. J., Doetschman T., Wang T., Giebisch G., Aronson P. S., Lorenz J. N., Shull G. E. (1998) Renal and intestinal absorptive defects in mice lacking the NHE3 Na+/H+ exchanger. Nat. Genet. 19, 282–285 - PubMed
    1. Donowitz M., Li X. (2007) Regulatory binding partners and complexes of NHE3. Physiol. Rev. 87, 825–872 - PubMed
    1. Ardura J. A., Friedman P. A. (2011) Regulation of G protein-coupled receptor function by Na+/H+ exchange regulatory factors. Pharmacol. Rev. 63, 882–900 - PMC - PubMed

Publication types

MeSH terms

LinkOut - more resources