

In vitro indeterminate teleost myogenesis appears to be dependent on Pax3
- PMID: 23613306
- PMCID: PMC4155499
- DOI: 10.1007/s11626-013-9616-2
In vitro indeterminate teleost myogenesis appears to be dependent on Pax3
Abstract
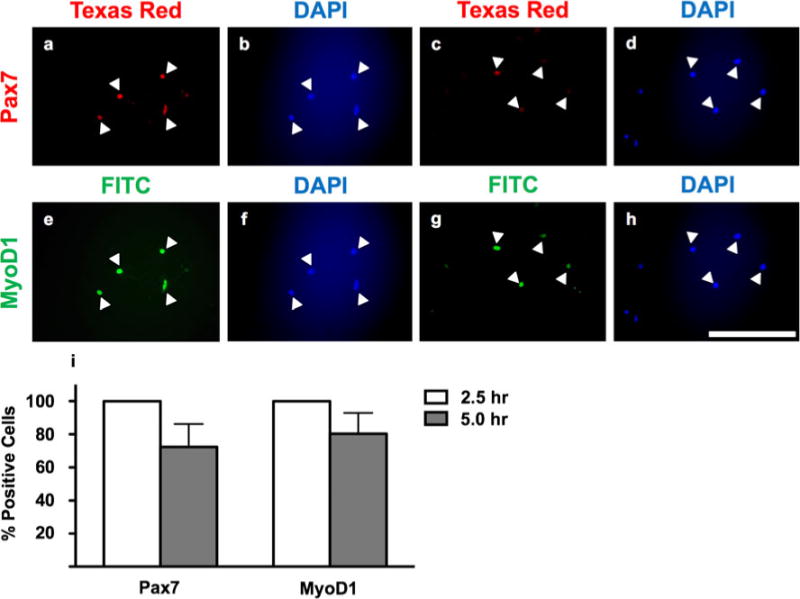
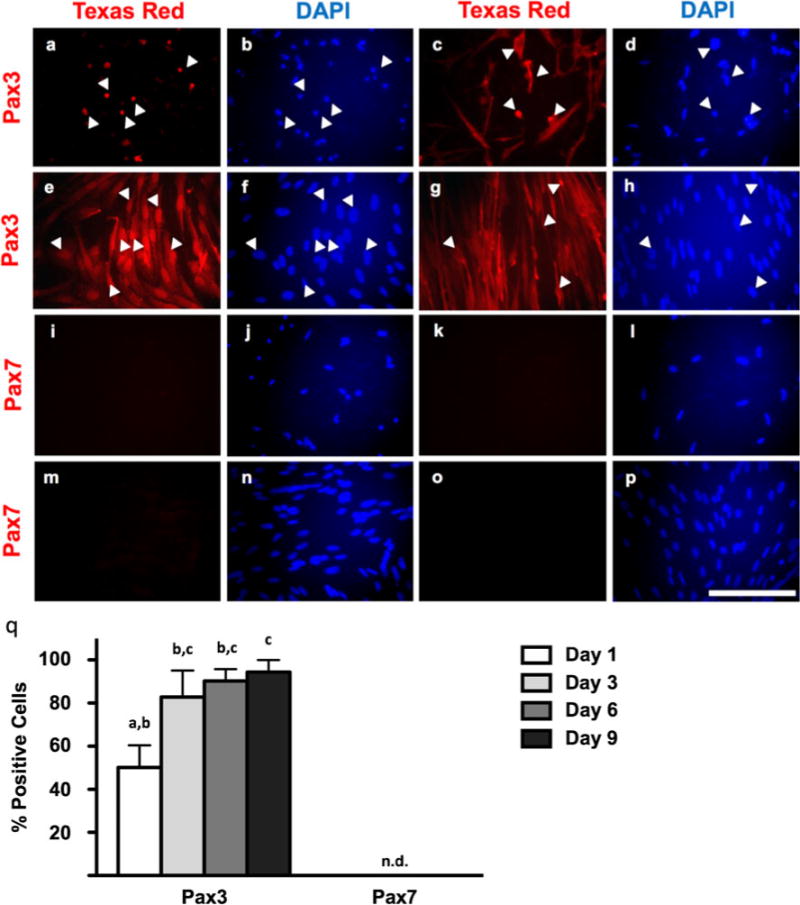
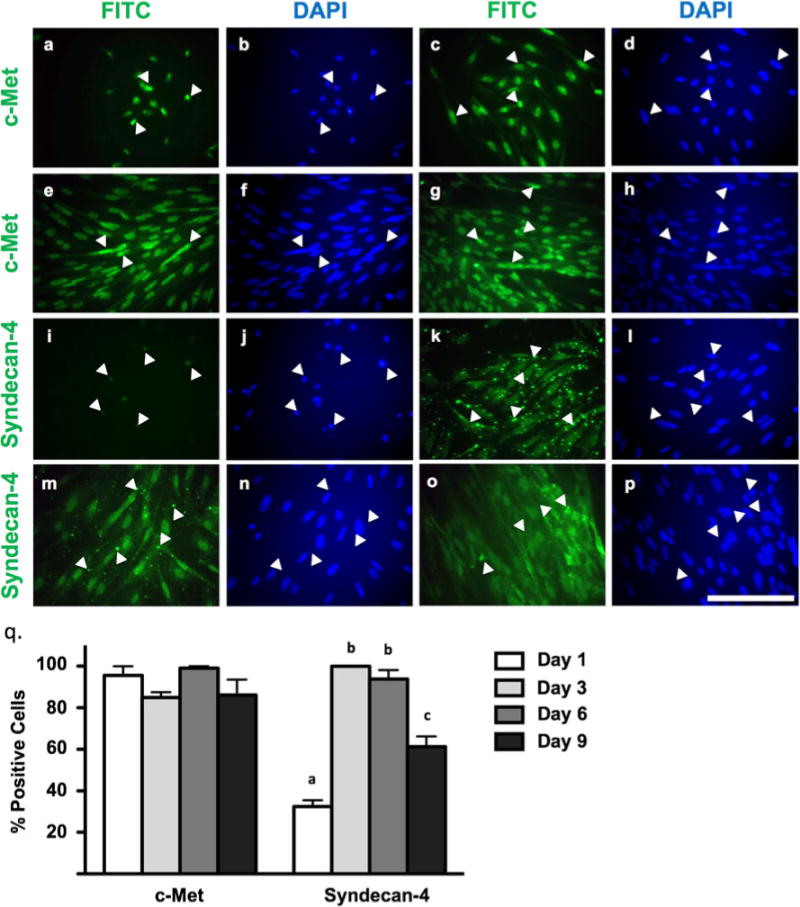
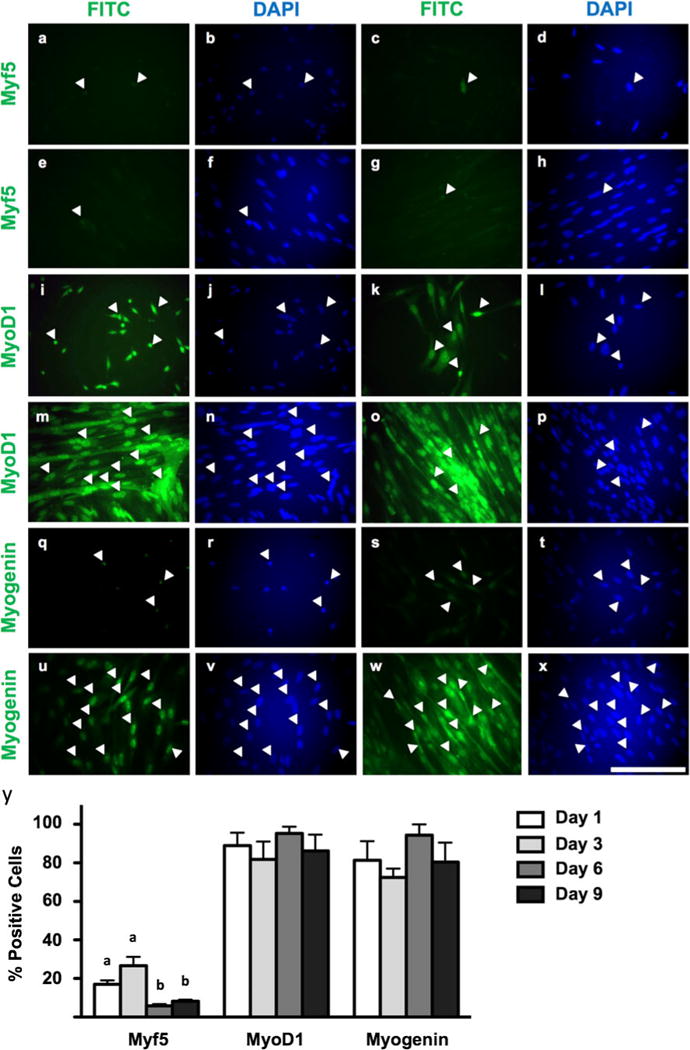
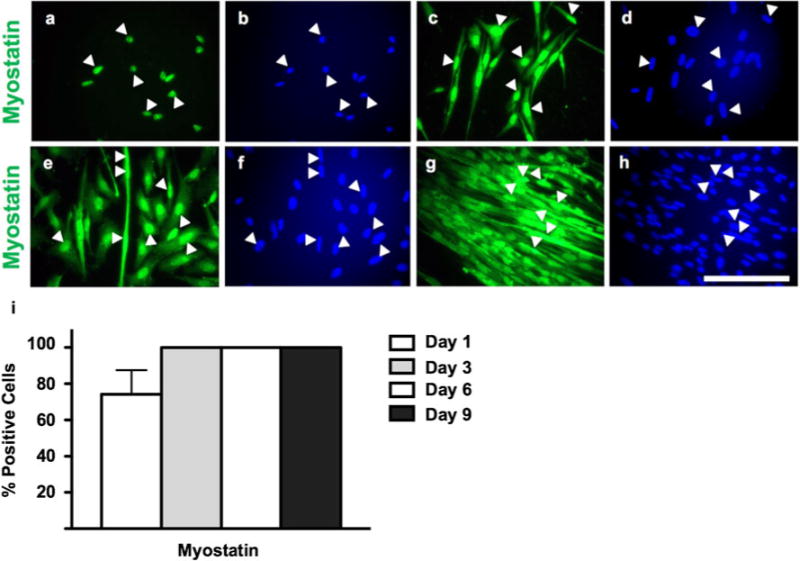
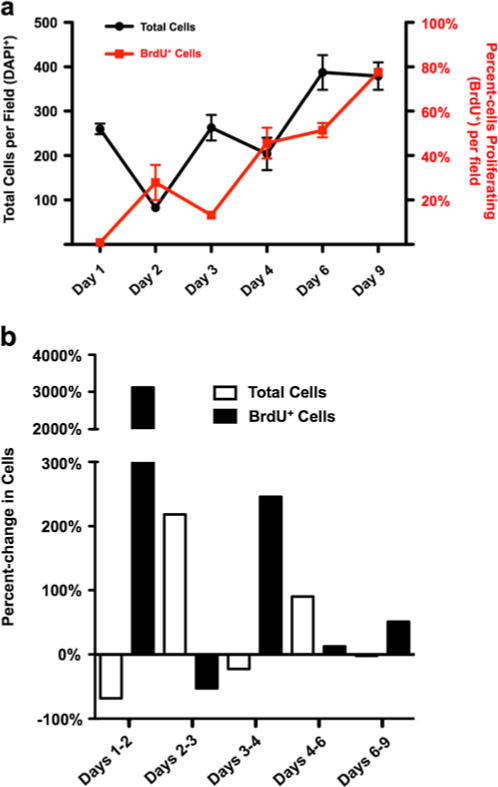
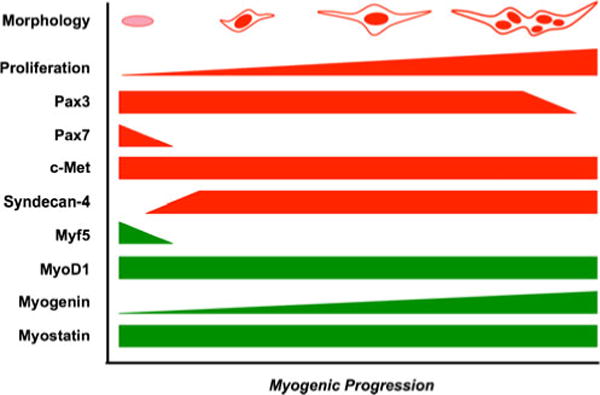
The zebrafish (Danio rerio) has been used extensively as a model system for developmental studies but, unlike most teleost fish, it grows in a determinate-like manner. A close relative, the giant danio (Devario cf. aequipinnatus), grows indeterminately, displaying both hyperplasia and hypertrophy of skeletal myofibers as an adult. To better understand adult muscle hyperplasia, a postlarval/postnatal process that closely resembles secondary myogenesis during development, we characterized the expression of Pax3/7, c-Met, syndecan-4, Myf5, MyoD1, myogenin, and myostatin during in vitro myogenesis, a technique that allows for the complete progression of myogenic precursor cells to myotubes. Pax7 appears to be expressed only in newly activated MPCs while Pax3 is expressed through most of the myogenic program, as are c-Met and syndecan-4. MyoD1 appears important in all stages of myogenesis, while Myf5 is likely expressed at low to background levels, and myogenin expression is enriched in myotubes. Myostatin, like MyoD1, appears to be ubiquitous at all stages. This is the first comprehensive report of key myogenic factor expression patterns in an indeterminate teleost, one that strongly suggests that Pax3 and/or Myf5 may be involved in the regulation of this paradigm. Further, it validates this species as a model organism for studying adult myogenesis in vitro, especially mechanisms underlying nascent myofiber recruitment.
Figures
Similar articles
-
Pax3 induces differentiation of juvenile skeletal muscle stem cells without transcriptional upregulation of canonical myogenic regulatory factors.J Cell Sci. 2010 Aug 1;123(Pt 15):2632-9. doi: 10.1242/jcs.061606. Epub 2010 Jul 6. J Cell Sci. 2010. PMID: 20605921 Free PMC article.
-
Signals and myogenic regulatory factors restrict pax3 and pax7 expression to dermomyotome-like tissue in zebrafish.Dev Biol. 2007 Feb 15;302(2):504-21. doi: 10.1016/j.ydbio.2006.10.009. Epub 2006 Oct 10. Dev Biol. 2007. PMID: 17094960 Free PMC article.
-
MicroRNA regulation of the paired-box transcription factor Pax3 confers robustness to developmental timing of myogenesis.Proc Natl Acad Sci U S A. 2011 Jul 19;108(29):11936-41. doi: 10.1073/pnas.1105362108. Epub 2011 Jul 5. Proc Natl Acad Sci U S A. 2011. PMID: 21730146 Free PMC article.
-
Function of the myogenic regulatory factors Myf5, MyoD, Myogenin and MRF4 in skeletal muscle, satellite cells and regenerative myogenesis.Semin Cell Dev Biol. 2017 Dec;72:19-32. doi: 10.1016/j.semcdb.2017.11.011. Epub 2017 Nov 15. Semin Cell Dev Biol. 2017. PMID: 29127046 Review.
-
Myogenic progenitor cells in the mouse embryo are marked by the expression of Pax3/7 genes that regulate their survival and myogenic potential.Anat Embryol (Berl). 2006 Dec;211 Suppl 1:51-6. doi: 10.1007/s00429-006-0122-0. Epub 2006 Oct 13. Anat Embryol (Berl). 2006. PMID: 17039375 Review.
Cited by
-
Phylogeny of zebrafish, a "model species," within Danio, a "model genus".Mol Biol Evol. 2015 Mar;32(3):635-52. doi: 10.1093/molbev/msu325. Epub 2014 Nov 20. Mol Biol Evol. 2015. PMID: 25415969 Free PMC article.
-
Muscle regeneration in gilthead sea bream: Implications of endocrine and local regulatory factors and the crosstalk with bone.Front Endocrinol (Lausanne). 2023 Jan 23;14:1101356. doi: 10.3389/fendo.2023.1101356. eCollection 2023. Front Endocrinol (Lausanne). 2023. PMID: 36755925 Free PMC article.
-
Ca2+ as a coordinator of skeletal muscle differentiation, fusion and contraction.FEBS J. 2022 Nov;289(21):6531-6542. doi: 10.1111/febs.16552. Epub 2022 Jun 25. FEBS J. 2022. PMID: 35689496 Free PMC article.
-
Differential microRNA Expression in Fast- and Slow-Twitch Skeletal Muscle of Piaractus mesopotamicus during Growth.PLoS One. 2015 Nov 3;10(11):e0141967. doi: 10.1371/journal.pone.0141967. eCollection 2015. PLoS One. 2015. PMID: 26529415 Free PMC article.
-
Pikeperch muscle tissues: a comparative study of structure, enzymes, genes, and proteins in wild and farmed fish.Fish Physiol Biochem. 2024 Aug;50(4):1527-1544. doi: 10.1007/s10695-024-01354-1. Epub 2024 May 11. Fish Physiol Biochem. 2024. PMID: 38733450 Free PMC article.
References
-
- Alfei L, Maggi F, Parvopassu F, Bertoncello G, De Vita R. Postlarval muscle growth in fish: a DNA flow cytometric and morphometric analysis. Basic Appl Histochem. 1989;33(2):147–158. - PubMed
-
- Allen RE, Sheehan SM, Taylor RG, Kendall TL, Rice GM. Hepatocyte growth factor activates quiescent skeletal muscle satellite cells in vitro. J Cell Physiol. 1995;165(2):307–312. - PubMed
-
- Anastasi S, Giordano S, Sthandier O, Gambarotta G, Maione R, Comoglio P, Amati P. A natural hepatocyte growth factor/scatter factor autocrine loop in myoblast cells and the effect of the constitutive Met kinase activation on myogenic differentiation. J Cell Biol. 1997;137(5):1057–1068. - PMC - PubMed
Publication types
MeSH terms
Substances
Grants and funding
LinkOut - more resources
Full Text Sources
Other Literature Sources
Molecular Biology Databases
Miscellaneous
