. 2013 Jul 15;591(14):3487-505.
doi: 10.1113/jphysiol.2013.251660. Epub 2013 Apr 22.

Putative pore-loops of TMEM16/anoctamin channels affect channel density in cell membranes

Affiliations

Putative pore-loops of TMEM16/anoctamin channels affect channel density in cell membranes

Aiste Adomaviciene et al. J Physiol. .

Abstract

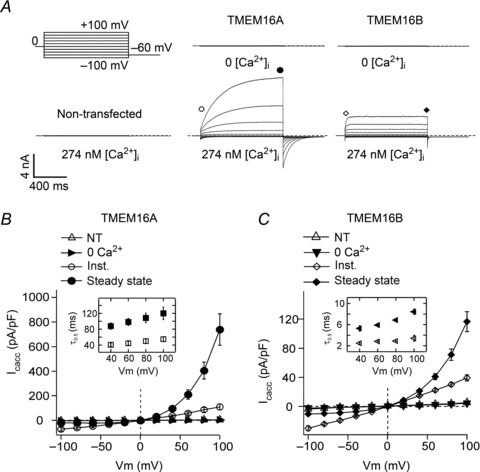
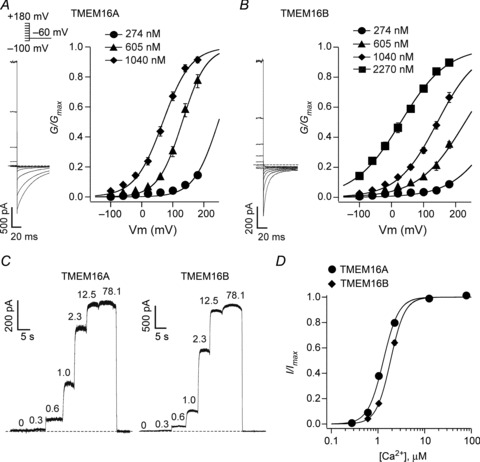
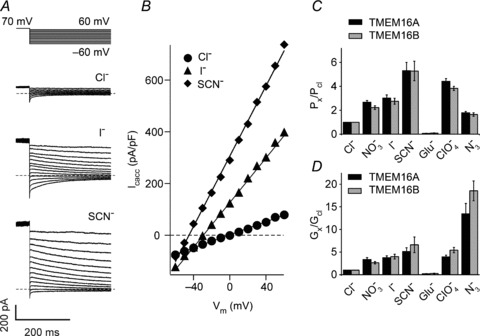
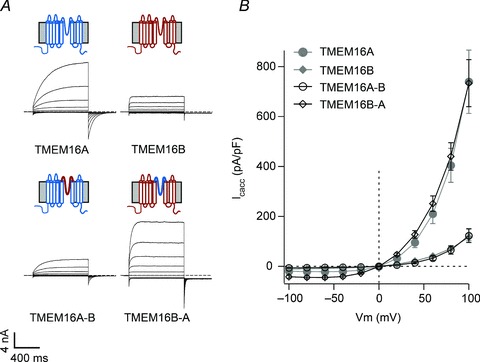
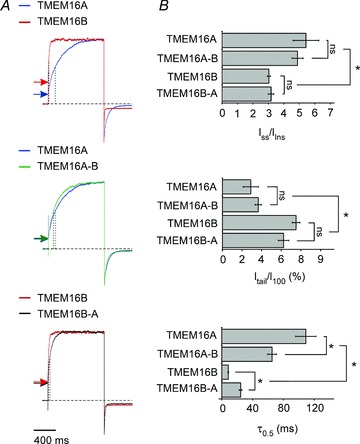
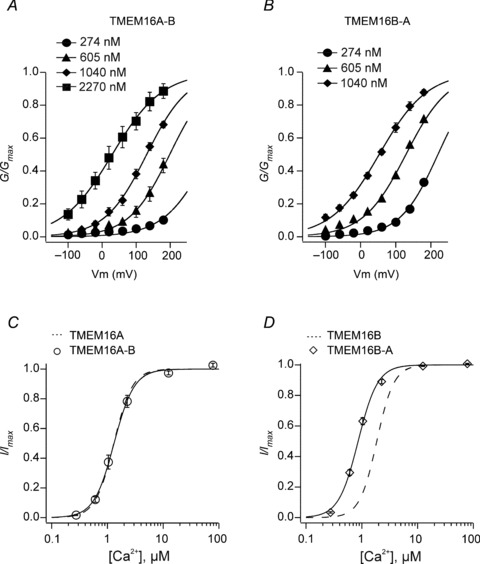
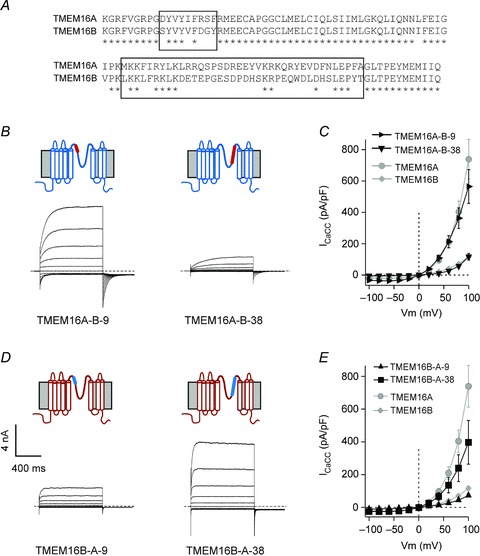
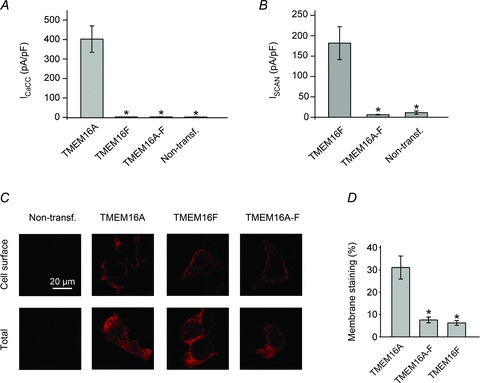
The recently identified TMEM16/anoctamin protein family includes Ca(2+)-activated anion channels (TMEM16A, TMEM16B), a cation channel (TMEM16F) and proteins with unclear function. TMEM16 channels consist of eight putative transmembrane domains (TMs) with TM5-TM6 flanking a re-entrant loop thought to form the pore. In TMEM16A this region has also been suggested to contain residues involved in Ca(2+) binding. The role of the putative pore-loop of TMEM16 channels was investigated using a chimeric approach. Heterologous expression of either TMEM16A or TMEM16B resulted in whole-cell anion currents with very similar conduction properties but distinct kinetics and degrees of sensitivity to Ca(2+). Furthermore, whole-cell currents mediated by TMEM16A channels were ∼six times larger than TMEM16B-mediated currents. Replacement of the putative pore-loop of TMEM16A with that of TMEM16B (TMEM16A-B channels) reduced the currents by ∼six-fold, while the opposite modification (TMEM16B-A channels) produced a ∼six-fold increase in the currents. Unexpectedly, these changes were not secondary to variations in channel gating by Ca(2+) or voltage, nor were they due to changes in single-channel conductance. Instead, they depended on the number of functional channels present on the plasma membrane. Generation of additional, smaller chimeras within the putative pore-loop of TMEM16A and TMEM16B led to the identification of a region containing a non-canonical trafficking motif. Chimeras composed of the putative pore-loop of TMEM16F transplanted into the TMEM16A protein scaffold did not conduct anions or cations. These data suggest that the putative pore-loop does not form a complete, transferable pore domain. Furthermore, our data reveal an unexpected role for the putative pore-loop of TMEM16A and TMEM16B channels in the control of the whole-cell Ca(2+)-activated Cl(-) conductance.


Figures

Figure 1
Figure 1. Whole-cell TMEM16A and TMEM16B currents
A, whole-cell currents recorded from a non-transfected HEK-293T cell or HEK-293T cells expressing TMEM16A or TMEM16B in the presence of 0 or 274 nm[Ca2+]i, as indicated. Dashed horizontal lines represent the zero-current level. Voltage protocol is shown in the upper left panel. B, mean whole-cell current density versus voltage relationships measured at the beginning (Inst.) or at the end (Steady state) of 1 s voltage pulses from −100 to +100 mV in 20 mV increments for HEK-293T cells expressing TMEM16A in the presence of 274 nm[Ca2+]i (n= 7). Mean whole-cell currents obtained from non-transfected (NT) HEK-293T cells ([Ca2+]i= 274 nm) (n= 5), and from transfected cells in 0 [Ca2+]i (n= 5) were measured only at the end of the pulse. C, mean whole-cell current density versus voltage relationships for TMEM16B (n= 8). Experimental conditions as described in B. Insets in B and C show mean τ0.5 of current activation (filled symbols) and deactivation (open symbols) for TMEM16A and TMEM16B, measured in the presence of 274 nm[Ca2+]i at various membrane potentials (n= 7–8).
Figure 2
Figure 2. Voltage and Ca2+-sensitivity of TMEM16A and TMEM16B channels
A, left panel: tail currents recorded from an inside-out patch excised from a HEK-293T cell expressing TMEM16A, in the presence of 605 nm[Ca2+]i. Stimulation protocol shown above. Horizontal dashed line indicates the zero-current level. Right panel: mean normalised TMEM16A conductance versus voltage relationships obtained in the presence of 274, 605 or 1040 nm[Ca2+]i, as indicated (n= 9). B, left panel: tail currents recorded from an inside-out patch excised from an HEK-293T cell expressing TMEM16B in the presence of 605 nm[Ca2+]i in response to the stimulation protocol shown in A. Horizontal dashed line indicates the zero-current level. Right panel: mean normalised TMEM16B conductance versus voltage relationships obtained in the presence of 274, 605, 1040 or 2270 nm[Ca2+]i, as indicated (n= 7). The smooth curves in A and B are the best fits of the data using eqn. (1). C, currents recorded from inside-out patches excised from HEK-293T cell expressing TMEM16A or TMEM16B in response to various [Ca2+]im), as indicated. The voltage was maintained at +70 mV for the whole duration of the recordings. D, mean relationships between [Ca2+]i and the current measured at +70 mV and normalised to the maximal response for TMEM16A (n= 5) and TMEM16B (n= 6). The smooth curves are the best fits of the data using eqn. (3).
Figure 3
Figure 3. Non-stationary noise analysis for whole-cell TMEM16A and TMEM16B currents
Whole-cell currents were recorded from HEK-293T cells expressing TMEM16A or TMEM16B channels. A, mean TMEM16A current and variance around the mean obtained from 165 current traces recorded in response to 1.5 s pulses to +70 mV followed by 1 s repolarizations to −60 mV in the presence of 274 nm[Ca2+]i. Horizontal dashed lines represent the zero-current or zero-variance level. B, current variance plotted against the mean current for the experiment shown in A. The parabolic line is the best of the data using eqn (4). The single-channel current, i, calculated from the fit was 0.24 pA. C, mean TMEM16B current and variance around the mean obtained from 200 current traces recorded in response to the stimulation protocol described in A. Horizontal dashed lines represent the zero-current or zero-variance level. D, current variance plotted against the mean current for the experiment shown in C. The parabolic line is the best of the data using eqn (4). The single-channel current, i, calculated from the fit was 0.27 pA.
Figure 4
Figure 4. Permeability and selectivity of TMEM16A and TMEM16B channels to a range of anions
A, whole-cell currents recorded from a HEK-293T cell expressing TMEM16A in the presence of 274 nm[Ca2+]i and different extracellular anions, as indicated. Dashed horizontal lines indicate zero-current levels. For the currents recorded in the presence of Cl only traces every 20 mV are shown for clarity. The stimulation protocol is shown above. B, instantaneous currents (obtained from traces in A) plotted versus the voltage. C, mean relative anion selectivity (Px/PCl) for TMEM16A (n= 6–12) and TMEM16B (n= 6–9) channels. D, mean relative anion conductance (Gx/GCl) for TMEM16A (n= 6–12) and TMEM16B (n= 6–9) channels.
Figure 5
Figure 5. Whole-cell currents for wild-type and chimeric TMEM16 channels
A, whole-cell currents recorded from HEK-293T cells expressing TMEM16A, TMEM16B, TMEM16A-B or TMEM16B-A, as indicated. Currents were elicited by 1 s voltage pulses from −100 to +100 mV in 20 mV increments followed by 0.5 s steps to −60 mV in the presence of 274 nm[Ca2+]i. Dashed horizontal lines represent the zero-current level. Diagrams above electrophysiological traces are schematic illustrations of the membrane topology of TMEM16 channels (wild-type, chimeras). TMEM16A and TMEM16B are represented in blue and red, respectively. B, mean whole-cell current density versus voltage relationships for TMEM16A (n= 7), TMEM16B (n= 8), TMEM16A-B (n= 7) and TMEM16B-A (n= 8). Data for TMEM16A and TMEM16B are re-plotted from Fig. 1.
Figure 6
Figure 6. Current characteristics of wild-type and chimeric TMEM16 channels
A, whole-cell currents recorded from HEK-293T cells expressing TMEM16A, TMEM16B, TMEM16A-B or TMEM16B-A, as indicated. Currents were elicited by a 1 s voltage pulse to +100 mV followed by a 0.5 s repolarisation to −60 mV in the presence of 274 nm[Ca2+]i. Horizontal arrows and vertical punctuated lines indicate instantaneous currents and τ0.5 of activation, respectively. The horizontal dashed lines indicate the zero-current level. Currents have been normalised to allow visual comparison. B, mean Iss/IInst, Itail/I100 and τ0.5 of current activation at +100 mV for TMEM16A (n= 7), TMEM16B (n= 8), TMEM16A-B (n= 7) and TMEM16B-A (n= 8), as indicated. Asterisks indicate significant differences (P < 0.05); ‘ns’ indicates that the difference between the two groups was not significant (P > 0.05).
Figure 7
Figure 7. Ca2+-sensitivity of chimeric TMEM16 channels
A, mean normalised TMEM16A-B conductance versus voltage relationships obtained in the presence of 274, 605, 1040 or 2270 nm[Ca2+]i, as indicated (n= 5). B, mean normalised TMEM16B-A conductance versus voltage relationships obtained in the presence of 274, 605 or 1040 nm[Ca2+]i, as indicated (n= 5). C, mean relationships between [Ca2+]i and inside-out TMEM16A-B currents normalised to the maximal response measured at +70 mV (n= 6). D, mean relationships between [Ca2+]i and inside-out TMEM16B-A currents normalised to the maximal response measured at +70 mV (n= 6). The smooth curves in C and D represent the best fits of the data using eqn (3). Dashed curves in C and D are the fits of the data for TMEM16A and TMEM16B, re-plotted from Fig. 2.
Figure 8
Figure 8. Current-voltage relationship of additional chimeric TMEM16 channels
A, sequence alignment of the putative pore-loop of TMEM16A (599–705) and TMEM16B (644–750) proteins. Asterisks indicate residues that are identical in the two channels. Boxes indicate the regions of nine and 38 residues that are substantially different between TMEM16A and TMEM16B channels. B, whole-cell currents recorded from HEK-293T cells expressing TMEM16A-B-9 and TMEM16A-B-38 chimeric channels in response to the voltage protocol shown in Fig. 1A and in the presence of 274 nm[Ca2+]i. Dashed horizontal lines represent the zero-current level. Diagrams above electrophysiological traces are schematic illustrations of the membrane topology of TMEM16A-B-9 and TMEM16A-B-38 chimeric channels. Segments of TMEM16A and TMEM16B are represented in blue and red, respectively. C, mean whole-cell current density versus voltage relationships for TMEM16A-B-9 (n= 5), TMEM16A-B-38 (n= 4), TMEM16A (n= 7) and TMEM16B (n= 8), as indicated. Data for TMEM16A and TMEM16B are re-plotted from Fig. 1. D, whole-cell currents recorded from HEK-293T cells expressing TMEM16B-A-9 and TMEM16B-A-38 chimeric channels in response to the voltage protocol shown in Fig. 1A and in the presence of 274 nm[Ca2+]i. Dashed horizontal lines represent the zero-current level. Diagrams above electrophysiological traces are schematic illustrations of the membrane topology of TMEM16B-A-9 and TMEM16B-A-38 chimeric channels. Segments of TMEM16A and TMEM16B are represented in blue and red, respectively. E, mean whole-cell current density versus voltage relationships for TMEM16B-A-9 (n= 6), TMEM16B-A-38 (n= 5), TMEM16A (n= 7) and TMEM16B (n= 8), as indicated. Data for TMEM16A and TMEM16B are re-plotted from Fig. 1.
Figure 9
Figure 9. Whole-cell current density and surface expression of TMEM16A, TMEM16F and TMEM16A-F channels
A, mean whole-cell Cl current density recorded from non-transfected HEK-293T cells and cells expressing TMEM16A, TMEM16F or TMEM16A-F measured at +80 mV in the presence of 274 nm[Ca2+]i (n= 5–7). B, mean whole-cell SCAN current density recorded from non-transfected HEK-293T cells and cells expressing TMEM16F or TMEM16A-F measured at +80 mV in the presence of ∼100 μm[Ca2+]i (n= 8–11). C, epifluorescence images of non-transfected HEK-293T cells or cells expressing HA-tagged TMEM16A, TMEM16F or TMEM16A-F, as indicated (see Supplemental material for details). Anti-HA antibodies were visualised with Alexa Fluor 596-labelled secondary antibodies (red) in non-permeabilised (Cell surface) or permeabilised (Total) conditions, as indicated. For each construct, images were acquired using identical acquisition settings. D, mean cell surface labelling expressed as a percentage of the total labelling for all HA-tagged constructs (n= 35–73; obtained using four consecutive cultures of transiently transfected HEK-293T cells). Asterisks indicate a significant difference to TMEM16A (P < 0.05).

Comment in

References

    1. Bader CR, Bertrand D, Schwartz EA. Voltage-activated and calcium-activated currents studied in solitary rod inner segments from the salamander retina. J Physiol. 1982;331:253–284. - PMC - PubMed
    1. Barish ME. A transient calcium-dependent chloride current in the immature Xenopus oocyte. J Physiol. 1983;342:309–325. - PMC - PubMed
    1. Barry PH, Lynch JW. Liquid junction potentials and small cell effects in patch-clamp analysis. J Membr Biol. 1991;121:101–117. - PubMed
    1. Bezanilla F. The voltage sensor in voltage-dependent ion channels. Physiol Rev. 2000;80:555–592. - PubMed
    1. Billig GM, Pal B, Fidzinski P, Jentsch TJ. Ca2+-activated Cl− currents are dispensable for olfaction. Nat Neurosci. 2011;14:763–769. - PubMed

Publication types

LinkOut - more resources