

doi: 10.2337/db12-1396.
Glucose variability
Affiliations
- PMID: 23613565
- PMCID: PMC3636651
- DOI: 10.2337/db12-1396
Item in Clipboard
Glucose variability
Diabetes.
2013 May.
Abstract
The proposed contribution of glucose variability to the development of the complications of diabetes beyond that of glycemic exposure is supported by reports that oxidative stress, the putative mediator of such complications, is greater for intermittent as opposed to sustained hyperglycemia. Variability of glycemia in ambulatory conditions defined as the deviation from steady state is a phenomenon of normal physiology. Comprehensive recording of glycemia is required for the generation of any measurement of glucose variability. To avoid distortion of variability to that of glycemic exposure, its calculation should be devoid of a time component.
Figures
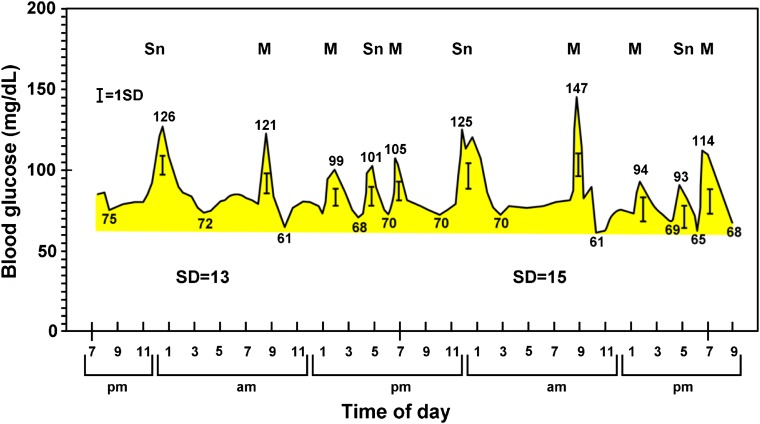
Continuous BG analysis for 48 h in an ambulatory fed normal subject. The timing and frequency of food ingestion matches that of the type 1 diabetic patient in Fig. 2. Note that each glucose excursion occurs in response to food ingestion and that each limb, ascending and descending, exceeds 1 SD of the 288 data points/24 h taken every 5 min from the 48-h tracing. Note the small difference in SD between days 1 and 2. Mean BG was 84 and 82 mg/dL and MAGE 41 and 48 for days 1 and 2, respectively. M, meal; Sn, snack.
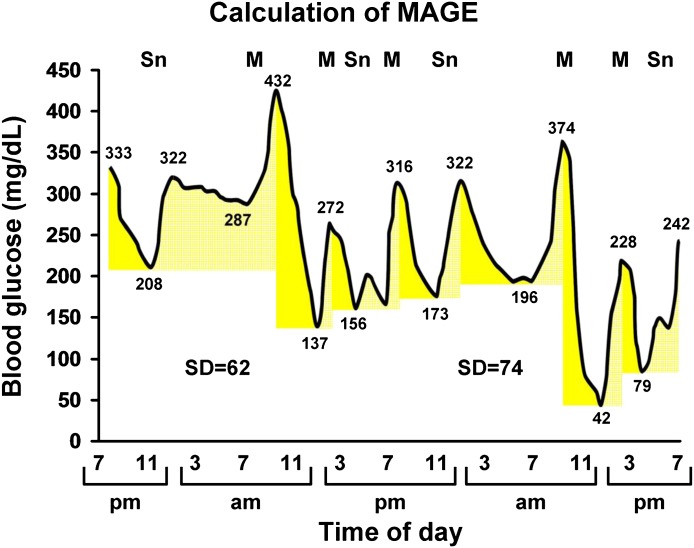
Continuous BG analysis for 48 h in a patient with type 1 diabetes. The qualifying excursions are shown as pairs of solid and stippled yellow beginning with the leftmost deflection, 333 to 208 mg/dL. The inflection component of that excursion is 208 to 432 mg/dL, which incorporates an intermediary excursion. The latter fails to qualify as an excursion on its own because one limb (322 to 287 mg/dL) fails to exceed 1 SD for that 24-h period. Note the small difference in SD from day 1 to day 2. Whether MAGE is calculated from the descending (184 mg/dL) or ascending (171 mg/dL) limbs, the values are similar. M, meal; Sn, snack.
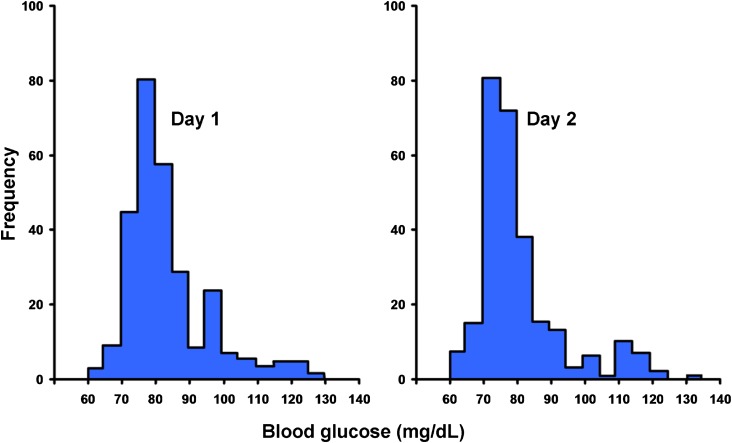
Frequency distribution of the 576 glucose values/48 h from Fig. 1 plotted per 24-h period showing a lack of normal distribution.
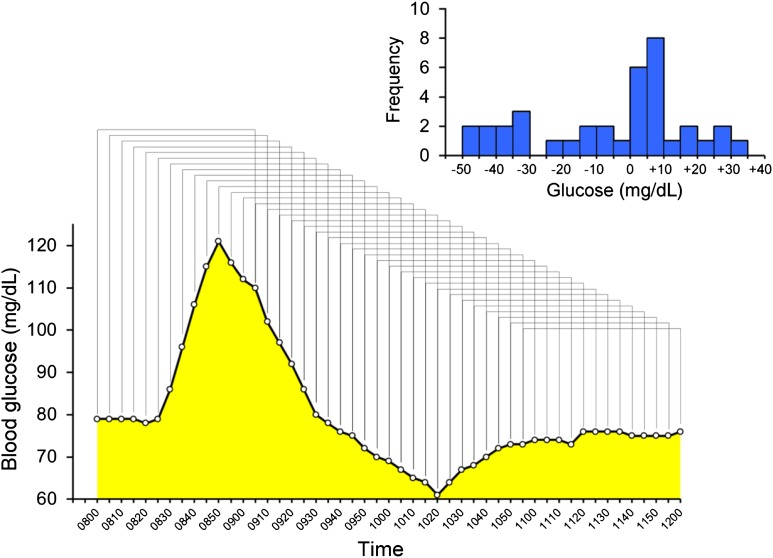
CONGA 1 analysis for the breakfast meal day 1 from Fig. 1. For illustration purposes only 4 h are shown. For this period, the mean of hourly differences determined at 5-min intervals is −5.5 mg/dL with an SD of 22.2, which is the actual CONGA value. The insert shows the frequency distribution of the sequential glucose differences, which clearly does not have a normal distribution.
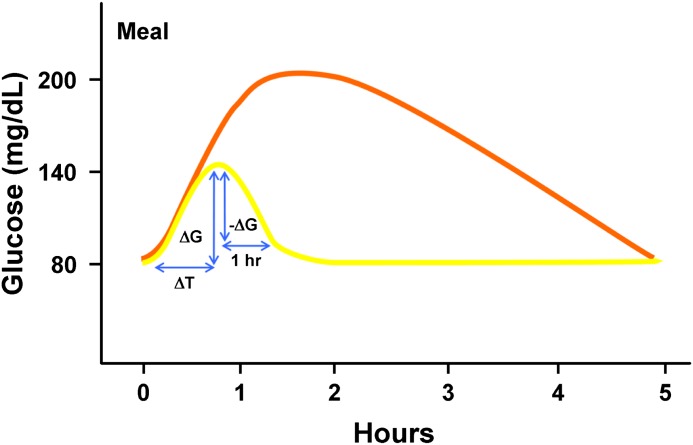
The orange line is a stylized representation of the best that can be achieved currently for meal-related glucose control in diabetes. Once therapies become available to bend the postprandial curve to match that of nondiabetic subjects (yellow line), new metrics will be needed. Glucose rise to peak (∆G), time to peak (∆T), and % baseline recovery 1 h after peak (−∆G/∆G) have been used for this purpose (50). Average values for these metrics in normal subjects are ∆G = 40 mg/dL, ∆T = 45 min, and baseline recovery 1 h after peak = 90%.
References
-
- The Diabetes Control and Complications Trial Research Group The effect of intensive treatment of diabetes on the development and progression of long-term complications in insulin-dependent diabetes mellitus. N Engl J Med 1993;329:977–986 - PubMed
-
- UK Prospective Diabetes Study (UKPDS) Group Intensive blood-glucose control with sulphonylureas or insulin compared with conventional treatment and the risk of complications in patients with type 2 diabetes (UKPDS33). Lancet; 1998;352:837–853 - PubMed
-
- Hirsch IB, Brownlee M. Should minimal BG variability become the gold standard of glycemic control? J Diabetes Complications 2005;19:178–181 - PubMed
-
- Trence DL, Hirsch IB. Motherhood, apple pie, hemoglobin A(1C), and the DCCT. Endocr Pract 2012;18:78–84 - PubMed
-
- Lachin JM, Genuth S, Nathan DM, Zinman B, Rutledge BN; DCCT/EDIC Research Group Effect of glycemic exposure on the risk of microvascular complications in the Diabetes Control and Complications Trial—revisited. Diabetes 2008;57:995–1001 - PubMed
MeSH terms
Substances
LinkOut - more resources
Full Text Sources
Other Literature Sources
Medical
