Organic-matter loading determines regime shifts and alternative states in an aquatic ecosystem
- PMID: 23613583
- PMCID: PMC3651476
- DOI: 10.1073/pnas.1221037110
Organic-matter loading determines regime shifts and alternative states in an aquatic ecosystem
Abstract
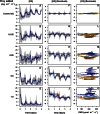
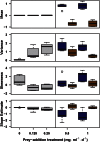
Slow changes in underlying state variables can lead to "tipping points," rapid transitions between alternative states ("regime shifts") in a wide range of complex systems. Tipping points and regime shifts routinely are documented retrospectively in long time series of observational data. Experimental induction of tipping points and regime shifts is rare, but could lead to new methods for detecting impending tipping points and forestalling regime shifts. By using controlled additions of detrital organic matter (dried, ground arthropod prey), we experimentally induced a shift from aerobic to anaerobic states in a miniature aquatic ecosystem: the self-contained pools that form in leaves of the carnivorous northern pitcher plant, Sarracenia purpurea. In unfed controls, the concentration of dissolved oxygen ([O2]) in all replicates exhibited regular diurnal cycles associated with daytime photosynthesis and nocturnal plant respiration. In low prey-addition treatments, the regular diurnal cycles of [O2] were disrupted, but a regime shift was not detected. In high prey-addition treatments, the variance of the [O2] time series increased until the system tipped from an aerobic to an anaerobic state. In these treatments, replicate [O2] time series predictably crossed a tipping point at ~45 h as [O2] was decoupled from diurnal cycles of photosynthesis and respiration. Increasing organic-matter loading led to predictable changes in [O2] dynamics, with high loading consistently driving the system past a well-defined tipping point. The Sarracenia microecosystem functions as a tractable experimental system in which to explore the forecasting and management of tipping points and alternative regimes.
Conflict of interest statement
The authors declare no conflict of interest.
Figures


References
-
- Scheffer MJ, et al. Early-warning signals for critical transitions. Nature. 2009;461(7260):53–59. - PubMed
-
- Carpenter SR, et al. Early warnings of regime shifts: A whole-ecosystem experiment. Science. 2011;332(6033):1079–1082. - PubMed
-
- Carpenter SR, Brock WA. Rising variance: A leading indicator of ecological transition. Ecol Lett. 2006;9(3):311–318. - PubMed
-
- Scheffer MJ, et al. Critical Transitions in Nature and Society. Princeton: Princeton Univ Press; 2009.
-
- Contamin R, Ellison AM. Indicators of regime shifts in ecological systems: What do we need to know and when do we need to know it? Ecol Appl. 2009;19(3):799–816. - PubMed
Publication types
MeSH terms
Substances
LinkOut - more resources
Full Text Sources
Other Literature Sources
Miscellaneous

