Pituitary adenylate cyclase activating peptide deficient mice exhibit impaired thymic and extrathymic regulatory T cell proliferation during EAE
- PMID: 23613811
- PMCID: PMC3628797
- DOI: 10.1371/journal.pone.0061200
Pituitary adenylate cyclase activating peptide deficient mice exhibit impaired thymic and extrathymic regulatory T cell proliferation during EAE
Abstract
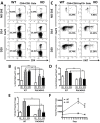
We have shown that mice deficient in pituitary adenylate cyclase-activating polypeptide (PACAP, gene name ADCYAP1) manifest enhanced sensitivity to experimental autoimmune encephalomyelitis (EAE), supporting the anti-inflammatory actions described for this neuropeptide. In addition to an increased proinflammatory cytokine response in these mice, a reduction in regulatory T cell (Treg) abundance in the lymph nodes (LN) was observed, suggesting altered Treg kinetics. In the present study, we compared in PACAP deficient (KO) vs. wild type mice the abundances and rates of proliferation FoxP3(+) Tregs in three sites, the LN, central nervous system (CNS) and thymus and the relative proportions of Th1, Th2, and Th17 effector subsets in the LN and CNS. Flow cytometry analyses revealed a decrease in Treg proliferation and an increased T effector/Tregs ratio in the LN and CNS of PACAP KO mice. In the thymus, the primary site of do novo natural Treg production, the total numbers and proliferative rates of FoxP3(+) Tregs were significantly reduced. Moreover, the expression of IL-7, a cytokine implicated in thymic Treg expansion during EAE, failed to increase at the peak of the disease in the thymus and LN of PACAP KO mice. In addition to these Treg alterations, a specific reduction of Th2 cells (about 4-fold) was observed in the lymph nodes in PACAP KO mice, with no effects on Th1 and Th17 subsets, whereas in the CNS, Th1 and Th17 cells were increased and Th2 decreased. Our results suggest that endogenous production of the neuropeptide PACAP protects against EAE by modulating Treg expansion and Th subsets at multiple sites.
Conflict of interest statement
Figures


Similar articles
-
PACAP/PAC1 Regulation of Inflammation via Catecholaminergic Neurons in a Model of Multiple Sclerosis.J Mol Neurosci. 2019 Jul;68(3):439-451. doi: 10.1007/s12031-018-1137-8. Epub 2018 Jul 30. J Mol Neurosci. 2019. PMID: 30058008 Free PMC article.
-
VPAC2 (vasoactive intestinal peptide receptor type 2) receptor deficient mice develop exacerbated experimental autoimmune encephalomyelitis with increased Th1/Th17 and reduced Th2/Treg responses.Brain Behav Immun. 2015 Feb;44:167-175. doi: 10.1016/j.bbi.2014.09.020. Epub 2014 Oct 13. Brain Behav Immun. 2015. PMID: 25305591 Free PMC article.
-
Pituitary adenylyl cyclase-activating polypeptide is an intrinsic regulator of Treg abundance and protects against experimental autoimmune encephalomyelitis.Proc Natl Acad Sci U S A. 2009 Feb 10;106(6):2012-7. doi: 10.1073/pnas.0812257106. Epub 2009 Feb 3. Proc Natl Acad Sci U S A. 2009. PMID: 19190179 Free PMC article.
-
Role of Th17 cells in the pathogenesis of CNS inflammatory demyelination.J Neurol Sci. 2013 Oct 15;333(1-2):76-87. doi: 10.1016/j.jns.2013.03.002. Epub 2013 Apr 8. J Neurol Sci. 2013. PMID: 23578791 Free PMC article. Review.
-
VIP and PACAP: neuropeptide modulators of CNS inflammation, injury, and repair.Br J Pharmacol. 2013 Jun;169(3):512-23. doi: 10.1111/bph.12181. Br J Pharmacol. 2013. PMID: 23517078 Free PMC article. Review.
Cited by
-
The Potential of the Nose-to-Brain Delivery of PACAP for the Treatment of Neuronal Disease.Pharmaceutics. 2023 Jul 28;15(8):2032. doi: 10.3390/pharmaceutics15082032. Pharmaceutics. 2023. PMID: 37631246 Free PMC article. Review.
-
Differential Expression of PACAP/VIP Receptors in the Post-Mortem CNS White Matter of Multiple Sclerosis Donors.Int J Mol Sci. 2024 Aug 14;25(16):8850. doi: 10.3390/ijms25168850. Int J Mol Sci. 2024. PMID: 39201536 Free PMC article.
-
Immunomodulatory Roles of PACAP and VIP: Lessons from Knockout Mice.J Mol Neurosci. 2018 Sep;66(1):102-113. doi: 10.1007/s12031-018-1150-y. Epub 2018 Aug 13. J Mol Neurosci. 2018. PMID: 30105629 Review.
-
Pituitary adenylate cyclase-activating polypeptide (PACAP) protects against mitoxantrone-induced cardiac injury in mice.Peptides. 2017 Sep;95:25-32. doi: 10.1016/j.peptides.2017.07.007. Epub 2017 Jul 15. Peptides. 2017. PMID: 28720396 Free PMC article.
-
Protective Effects of Pituitary Adenylate Cyclase-Activating Polypeptide and Vasoactive Intestinal Peptide Against Cognitive Decline in Neurodegenerative Diseases.Front Cell Neurosci. 2020 Jul 17;14:221. doi: 10.3389/fncel.2020.00221. eCollection 2020. Front Cell Neurosci. 2020. PMID: 32765225 Free PMC article.
References
-
- Vaudry D, Falluel-Morel A, Bourgault S, Basille M, Burel D, et al. (2009) Pituitary adenylate cyclase-activating polypeptide and its receptors: 20 years after the discovery. Pharmacol Rev 61: 283–357. - PubMed
-
- Abad C, Gomariz RP, Waschek JA (2006) Neuropeptide mimetics and antagonists in the treatment of inflammatory disease: focus on VIP and PACAP. Curr Top Med Chem 6: 151–163. - PubMed
-
- Vaudry D, Gonzalez BJ, Basille M, Yon L, Fournier A, et al. (2000) Pituitary adenylate cyclase-activating polypeptide and its receptors: from structure to functions. Pharmacol Rev 52: 269–324. - PubMed
-
- Delgado M, Pozo D, Ganea D (2004) The significance of vasoactive intestinal peptide in immunomodulation. Pharmacol Rev 56: 249–290. - PubMed
Publication types
MeSH terms
Substances
Grants and funding
LinkOut - more resources
Full Text Sources
Other Literature Sources
Molecular Biology Databases
Research Materials

