

Human breast cancer tissues contain abundant phosphatidylcholine(36∶1) with high stearoyl-CoA desaturase-1 expression
- PMID: 23613812
- PMCID: PMC3629004
- DOI: 10.1371/journal.pone.0061204
Human breast cancer tissues contain abundant phosphatidylcholine(36∶1) with high stearoyl-CoA desaturase-1 expression
Erratum in
- PLoS One. 2013;8(9). doi:10.1371/annotation/63c5359c-b1d2-44d8-944f-7bde0d6ec946
Abstract
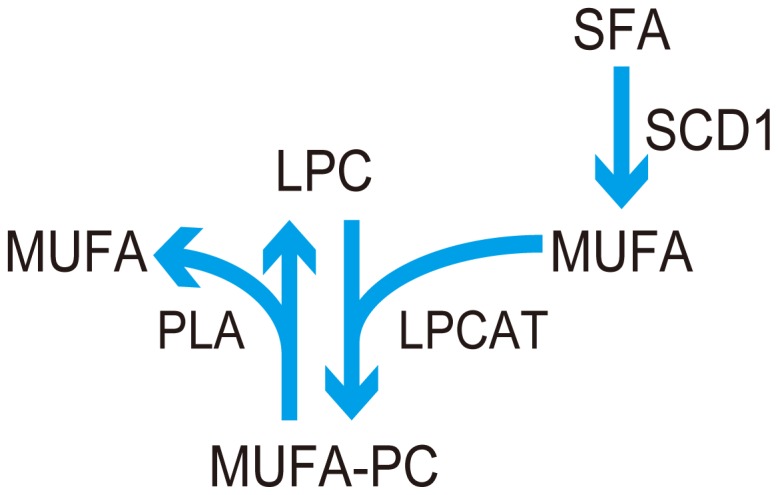
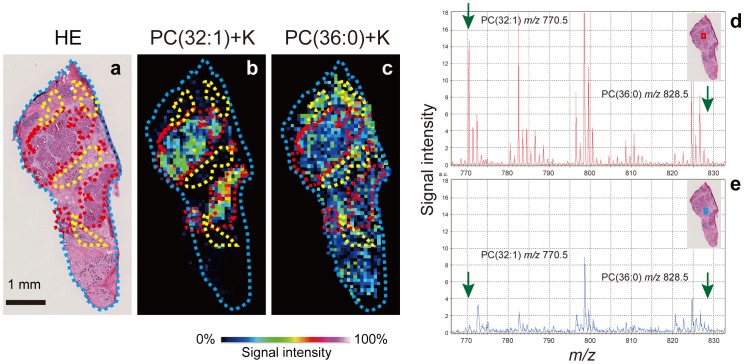
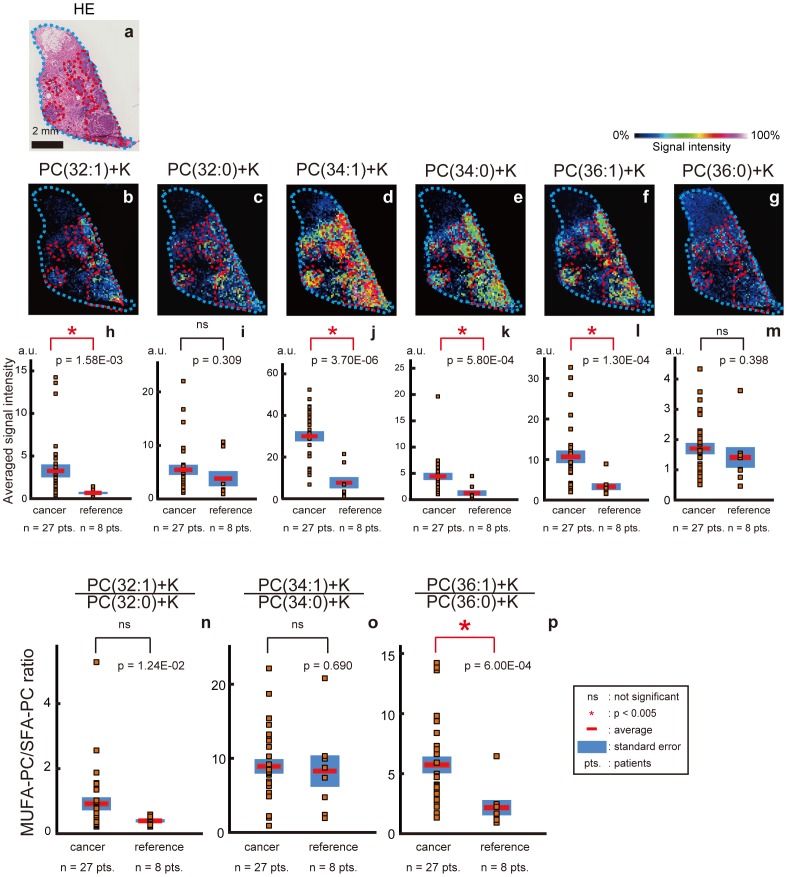
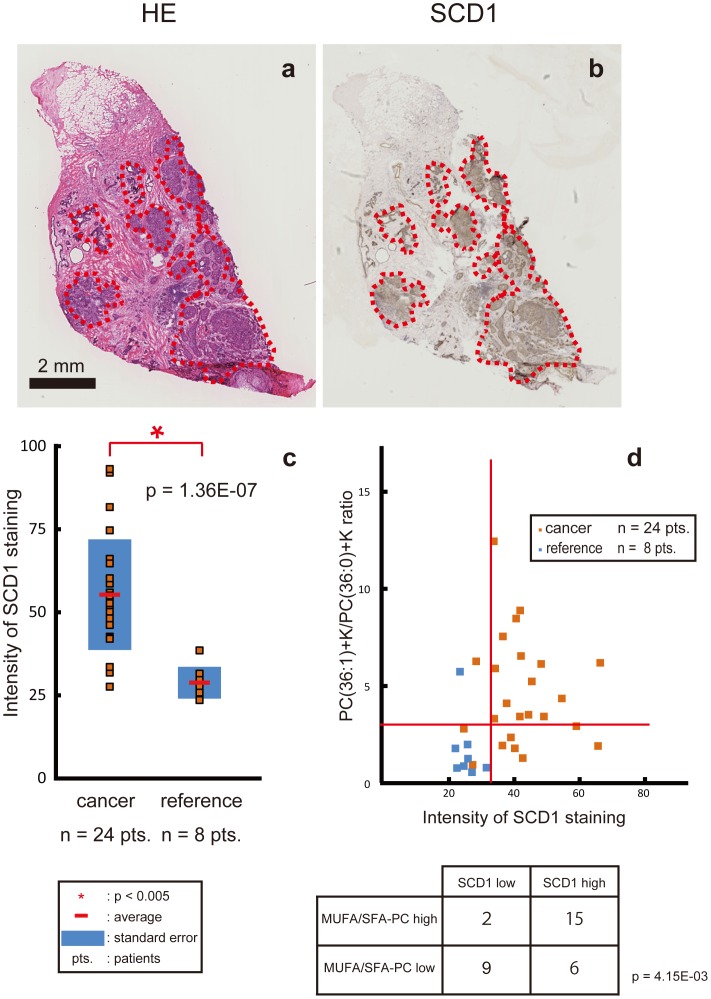
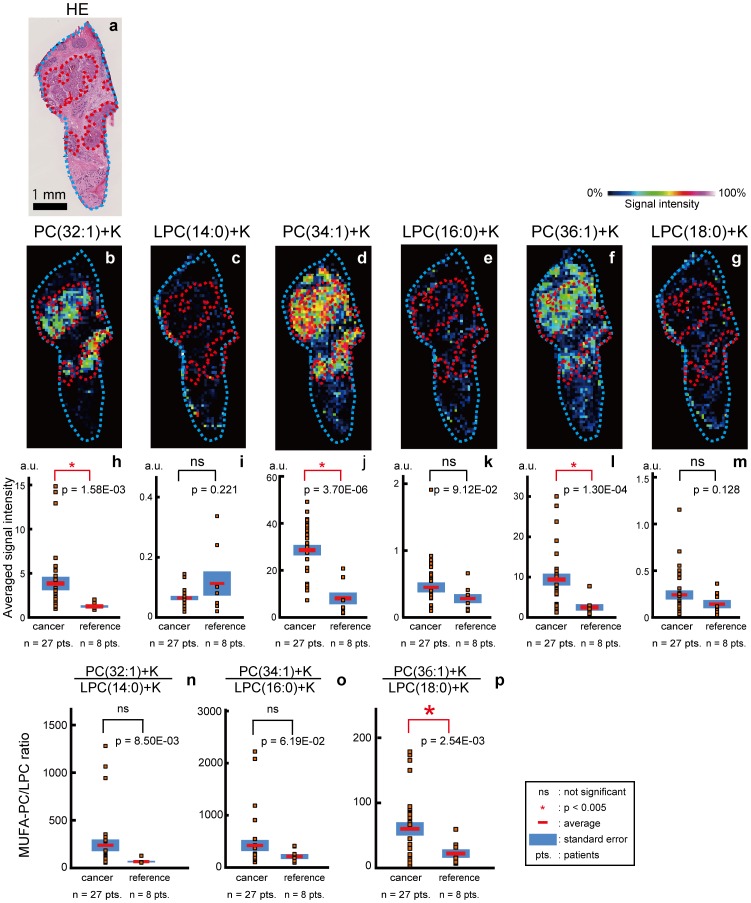
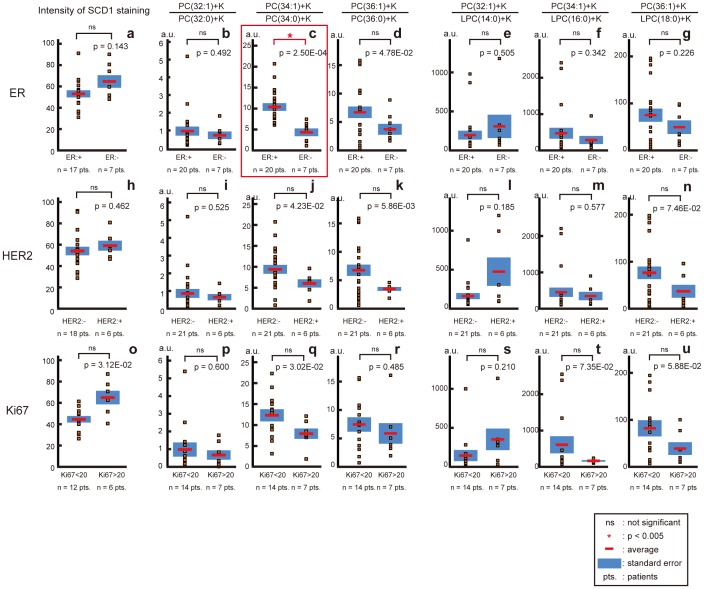
Breast cancer is the leading cause of cancer and mortality in women worldwide. Recent studies have argued that there is a close relationship between lipid synthesis and cancer progression because some enzymes related to lipid synthesis are overexpressed in breast cancer tissues. However, lipid distribution in breast cancer tissues has not been investigated. We aimed to visualize phosphatidylcholines (PCs) and lysoPCs (LPCs) in human breast cancer tissues by performing matrix assisted laser desorption/ionization-imaging mass spectrometry (MALDI-IMS), which is a novel technique that enables the visualization of molecules comprehensively. Twenty-nine breast tissue samples were obtained during surgery and subjected to MALDI-IMS analysis. We evaluated the heterogeneity of the distribution of PCs and LPCs on the tissues. Three species [PC(32∶1), PC(34∶1), and PC(36∶1)] of PCs with 1 mono-unsaturated fatty acid chain and 1 saturated fatty acid chain (MUFA-PCs) and one [PC(34∶0)] of PCs with 2 saturated fatty acid chains (SFA-PC) were relatively localized in cancerous areas rather than the rest of the sections (named reference area). In addition, the LPCs did not show any biased distribution. The relative amounts of PC(36∶1) compared to PC(36∶0) and that of PC(36∶1) to LPC(18∶0) were significantly higher in the cancerous areas. The protein expression of stearoyl-CoA desaturase-1 (SCD1), which is a synthetic enzyme of MUFA, showed accumulation in the cancerous areas as observed by the results of immunohistochemical staining. The ratios were further analyzed considering the differences in expressions of the estrogen receptor (ER), human epidermal growth factor receptor 2 (HER2), and Ki67. The ratios of the signal intensity of PC(34:1) to that of PC(34:0) was higher in the lesions with positive ER expression [corrected]. The contribution of SCD1 and other enzymes to the formation of the observed phospholipid composition is discussed.
Conflict of interest statement
Figures
Similar articles
-
Significantly increased monounsaturated lipids relative to polyunsaturated lipids in six types of cancer microenvironment are observed by mass spectrometry imaging.Sci Rep. 2014 Aug 5;4:5959. doi: 10.1038/srep05959. Sci Rep. 2014. PMID: 25091112 Free PMC article.
-
Clinical and biochemical relevance of monounsaturated fatty acid metabolism targeting strategy for cancer stem cell elimination in colon cancer.Biochem Biophys Res Commun. 2019 Oct 29;519(1):100-105. doi: 10.1016/j.bbrc.2019.08.137. Epub 2019 Aug 31. Biochem Biophys Res Commun. 2019. PMID: 31481234
-
Relationship between stearoyl-CoA desaturase 1 gene expression, relative protein abundance, and its fatty acid products in bovine tissues.J Dairy Res. 2014 Aug;81(3):333-9. doi: 10.1017/S0022029914000181. Epub 2014 Jun 6. J Dairy Res. 2014. PMID: 24904960
-
The fatty acid desaturation index of blood lipids, as a biomarker of hepatic stearoyl-CoA desaturase expression, is a predictive factor of breast cancer risk.Curr Opin Lipidol. 2011 Feb;22(1):6-10. doi: 10.1097/MOL.0b013e3283404552. Curr Opin Lipidol. 2011. PMID: 20935562 Review.
-
Stearoyl CoA desaturase-1: New insights into a central regulator of cancer metabolism.Biochim Biophys Acta. 2016 Dec;1861(12 Pt A):1865-1880. doi: 10.1016/j.bbalip.2016.09.009. Epub 2016 Sep 14. Biochim Biophys Acta. 2016. PMID: 27639967 Review.
Cited by
-
SCD1 is associated with tumor promotion, late stage and poor survival in lung adenocarcinoma.Oncotarget. 2016 Jun 28;7(26):39970-39979. doi: 10.18632/oncotarget.9461. Oncotarget. 2016. PMID: 27223066 Free PMC article.
-
Expanding Roles of De Novo Lipogenesis in Breast Cancer.Int J Environ Res Public Health. 2021 Mar 30;18(7):3575. doi: 10.3390/ijerph18073575. Int J Environ Res Public Health. 2021. PMID: 33808259 Free PMC article. Review.
-
Extracellular vesicles as a promising source of lipid biomarkers for breast cancer detection in blood plasma.J Extracell Vesicles. 2024 Mar;13(3):e12419. doi: 10.1002/jev2.12419. J Extracell Vesicles. 2024. PMID: 38443328 Free PMC article.
-
Lipidomics-based tissue heterogeneity in specimens of luminal breast cancer revealed by clustering analysis of mass spectrometry imaging: A preliminary study.PLoS One. 2023 May 10;18(5):e0283155. doi: 10.1371/journal.pone.0283155. eCollection 2023. PLoS One. 2023. PMID: 37163537 Free PMC article.
-
Lysophosphatidylcholine acyltransferase 1 upregulation and concomitant phospholipid alterations in clear cell renal cell carcinoma.J Exp Clin Cancer Res. 2017 May 12;36(1):66. doi: 10.1186/s13046-017-0525-1. J Exp Clin Cancer Res. 2017. PMID: 28494778 Free PMC article.
References
-
- Jemal A, Bray F (2011) Center MM, Ferlay J, Ward E, et al (2011) Global cancer statistics. CA Cancer J Clin 61: 69–90. - PubMed
-
- Menendez JA, Lupu R (2007) Fatty acid synthase and the lipogenic phenotype in cancer pathogenesis. Nat Rev Cancer 7: 763–777. - PubMed
-
- Ekroos K, Ejsing CS, Bahr U, Karas M, Simons K, et al. (2003) Charting molecular composition of phosphatidylcholines by fatty acid scanning and ion trap MS3 fragmentation. J Lipid Res 44: 2181–2192. - PubMed
-
- Katz-Brull R, Seger D, Rivenson-Segal D, Rushkin E, Degani H (2002) Metabolic markers of breast cancer: enhanced choline metabolism and reduced choline-ether-phospholipid synthesis. Cancer Res 62: 1966–1970. - PubMed
Publication types
MeSH terms
Substances
LinkOut - more resources
Full Text Sources
Other Literature Sources
Medical
Research Materials
Miscellaneous
