

Knockdown of FRAT1 expression by RNA interference inhibits human glioblastoma cell growth, migration and invasion
- PMID: 23613813
- PMCID: PMC3629175
- DOI: 10.1371/journal.pone.0061206
Knockdown of FRAT1 expression by RNA interference inhibits human glioblastoma cell growth, migration and invasion
Abstract
Background: FRAT1 positively regulates the Wnt/β-catenin signaling pathway by inhibiting GSK-3-mediated phosphorylation of β-catenin. It was originally characterized as a protein frequently rearranged in advanced T cell lymphoma, but has recently also been identified as a proto-oncogene involved in tumorigenesis. Our previous studies showed that FRAT1 was dramatically overexpressed in gliomas and its expression level was significantly increased along with clinicopathological grades.
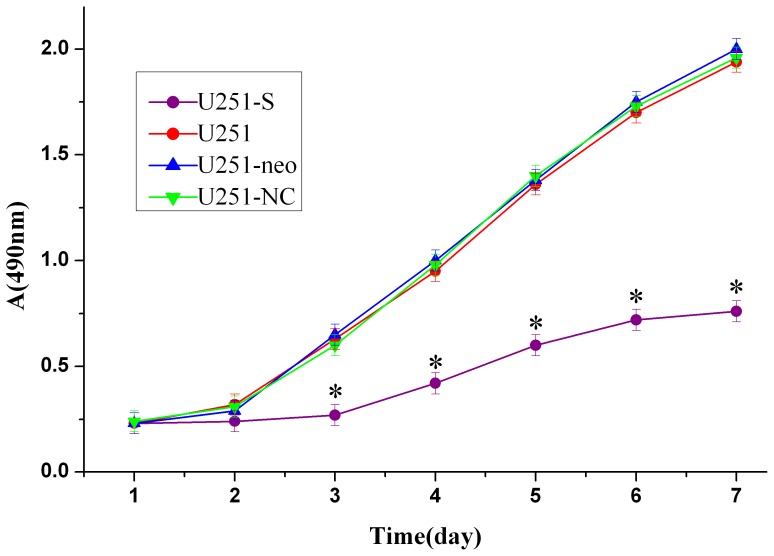
Methods: In the current study, we used RT-PCR and Western blotting to assess the mRNA and protein levels of FRAT1 in three glioma cell lines. In addition, to evaluate its functional role in gliomas, we examined the effects of FRAT1 knockdown on proliferation, migration and invasion in vitro and tumor growth in vivo using glioblastoma U251 cells and RNAi.
Results: FRAT1 was highly expressed in all three glioma cell lines. RNAi-mediated down-regulation of endogenous FRAT1 in human glioblastoma U251 cells resulted in suppression of cell proliferation, arrest of cell cycle, inhibition of cell migration and invasion in vitro. Moreover, FRAT1 depletion significantly impaired tumor xenograft growth in nude mice.
Conclusions: Our results highlight the potential role of FRAT1 in tumorigenesis and progression of glioblastoma. These findings provide a biological basis for FRAT1 as a potential molecular marker for improved pathological grading and as a novel candidate therapeutic target for glioblastoma management.
Conflict of interest statement
Figures


Similar articles
-
FRAT1 promotes the angiogenic properties of human glioblastoma cells via VEGFA.Mol Med Rep. 2022 Mar;25(3):95. doi: 10.3892/mmr.2022.12611. Epub 2022 Jan 21. Mol Med Rep. 2022. PMID: 35059733
-
The expression profile of FRAT1 in human gliomas.Brain Res. 2010 Mar 12;1320:152-8. doi: 10.1016/j.brainres.2010.01.037. Epub 2010 Jan 21. Brain Res. 2010. PMID: 20096670
-
Swertiamarin suppresses proliferation, migration, and invasion of hepatocellular carcinoma cells <em>via</em> negative regulation of FRAT1.Eur J Histochem. 2020 Oct 19;64(4):3169. doi: 10.4081/ejh.2020.3169. Eur J Histochem. 2020. PMID: 33131270 Free PMC article.
-
RNAi-mediated inhibition of MSP58 decreases tumour growth, migration and invasion in a human glioma cell line.J Cell Mol Med. 2009 Nov-Dec;13(11-12):4608-22. doi: 10.1111/j.1582-4934.2008.00499.x. J Cell Mol Med. 2009. PMID: 18798870 Free PMC article.
-
Epigenetic silencing of miR-490-3p promotes development of an aggressive colorectal cancer phenotype through activation of the Wnt/β-catenin signaling pathway.Cancer Lett. 2016 Jun 28;376(1):178-87. doi: 10.1016/j.canlet.2016.03.024. Epub 2016 Mar 29. Cancer Lett. 2016. PMID: 27037061
Cited by
-
STAT1 is a modulator of the expression of frequently rearranged in advanced T-cell lymphomas 1 expression in U251 cells.Oncol Lett. 2020 Jul;20(1):248-256. doi: 10.3892/ol.2020.11555. Epub 2020 Apr 21. Oncol Lett. 2020. PMID: 32565951 Free PMC article.
-
Current Understanding on EGFR and Wnt/β-Catenin Signaling in Glioma and Their Possible Crosstalk.Genes Cancer. 2013 Nov;4(11-12):427-46. doi: 10.1177/1947601913503341. Genes Cancer. 2013. PMID: 24386505 Free PMC article. Review.
-
Silencing of FRAT1 by siRNA inhibits the proliferation of SGC7901 human gastric adenocarcinoma cells.Biomed Rep. 2016 Feb;4(2):223-226. doi: 10.3892/br.2016.571. Epub 2016 Jan 11. Biomed Rep. 2016. PMID: 26893843 Free PMC article.
-
Significant Genes Associated with Mortality and Disease Progression in Grade II and III Glioma.Biomedicines. 2024 Apr 12;12(4):858. doi: 10.3390/biomedicines12040858. Biomedicines. 2024. PMID: 38672212 Free PMC article.
-
Long non-coding RNA DANCR promotes cervical cancer growth via activation of the Wnt/β-catenin signaling pathway.Cancer Cell Int. 2020 Feb 22;20:61. doi: 10.1186/s12935-020-1139-9. eCollection 2020. Cancer Cell Int. 2020. PMID: 32123519 Free PMC article.
References
-
- DeAngelis LM (2001) Brain tumors. N Engl J Med 344: 114–123. - PubMed
-
- Hess KR, Broglio KR, Bondy ML (2004) Adult glioma incidence trends in the United States, 1977–2000. Cancer 101: 2293–2299. - PubMed
-
- Saitoh T, Katoh M (2001) FRAT1 and FRAT2, clustered in human chromosome 10q24.1 region, are up-regulated in gastric cancer. Int J Oncol 19: 311–315. - PubMed
-
- Jonkers J, van Amerongen R, van der Valk M, Robanus-Maandag E, Molenaar M, et al. (1999) In vivo analysis of Frat1 deficiency suggests compensatory activity of Frat3. Mech Dev 88: 183–194. - PubMed
-
- Saitoh T, Moriwaki J, Koike J, Takagi A, Miwa T, et al. (2001) Molecular cloning and characterization of FRAT2, encoding a positive regulator of the WNT signaling pathway. Biochem Biophys Res Commun 281: 815–820. - PubMed
Publication types
MeSH terms
Substances
LinkOut - more resources
Full Text Sources
Other Literature Sources
