

Mild oxidative stress induces redistribution of BACE1 in non-apoptotic conditions and promotes the amyloidogenic processing of Alzheimer's disease amyloid precursor protein
- PMID: 23613819
- PMCID: PMC3629182
- DOI: 10.1371/journal.pone.0061246
Mild oxidative stress induces redistribution of BACE1 in non-apoptotic conditions and promotes the amyloidogenic processing of Alzheimer's disease amyloid precursor protein
Abstract
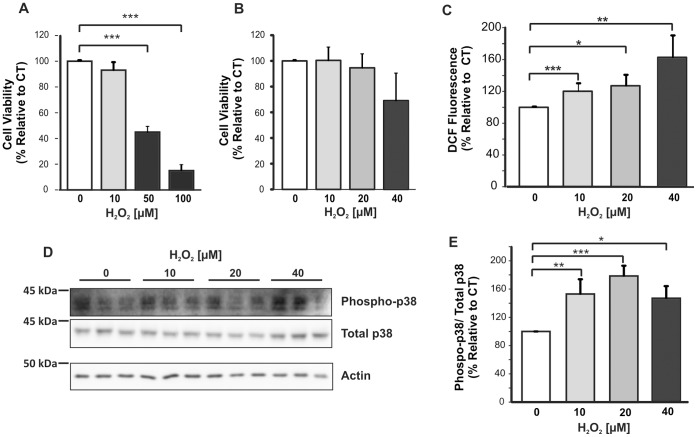
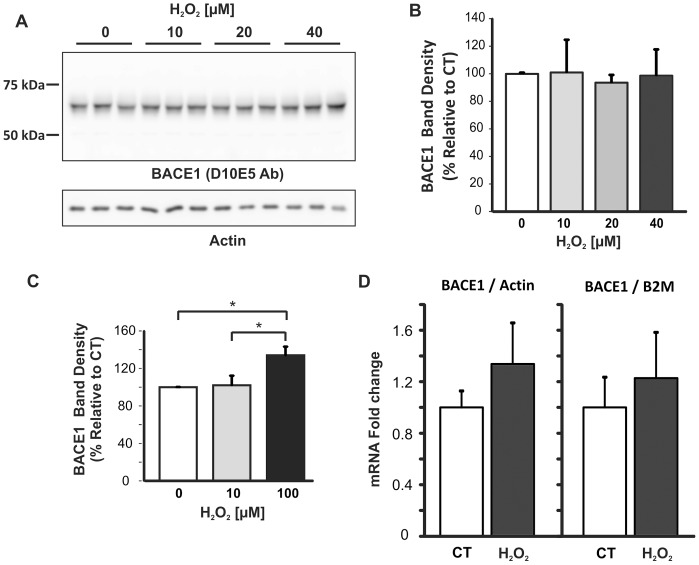
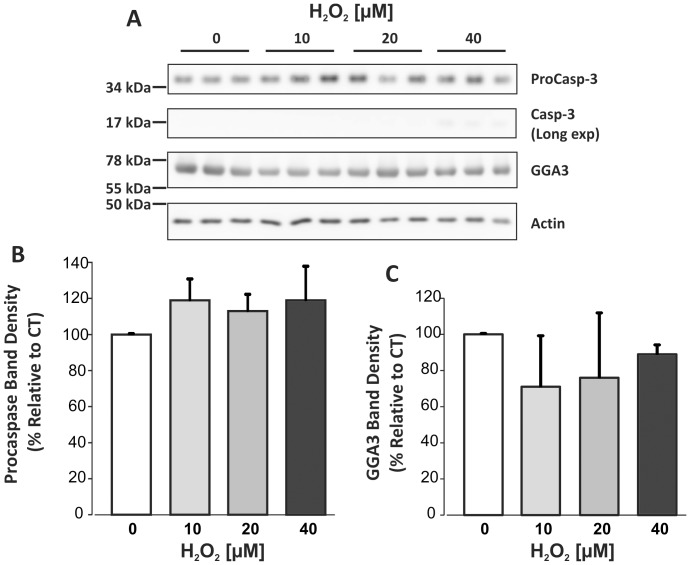
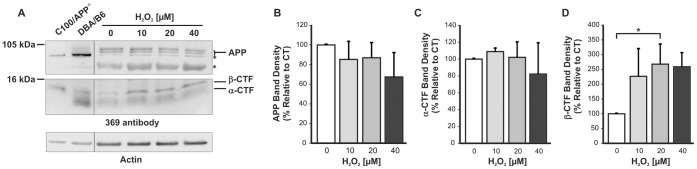
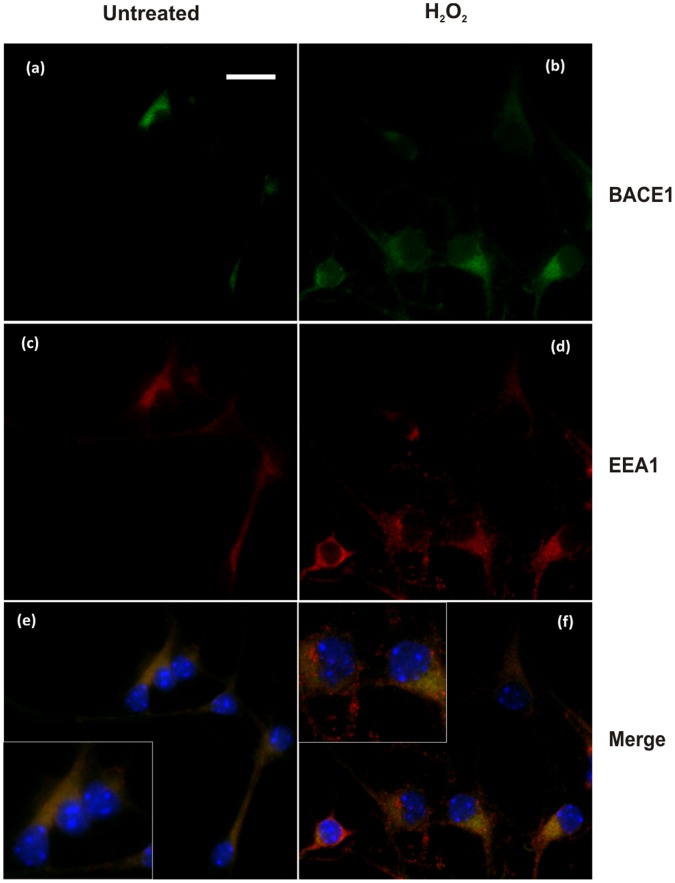
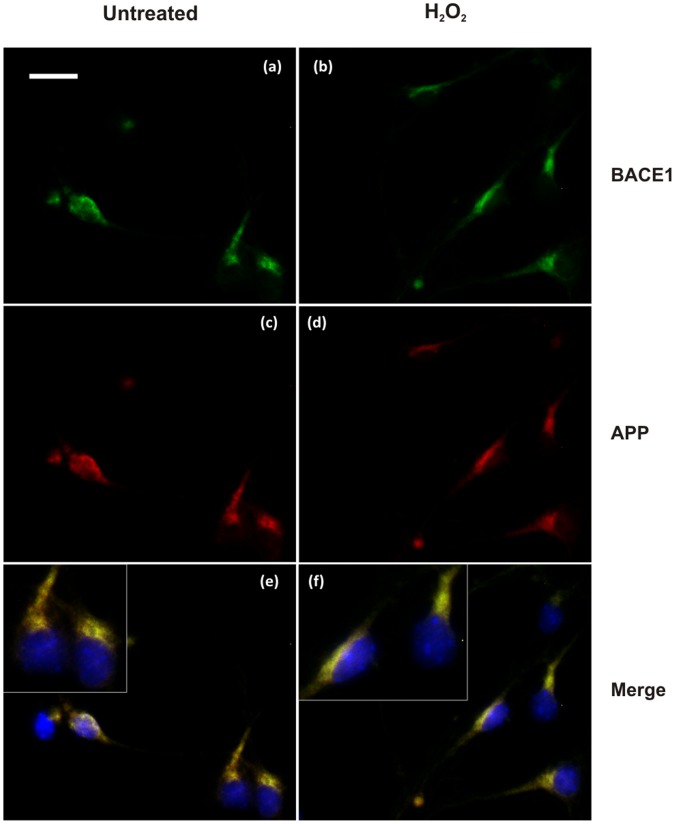
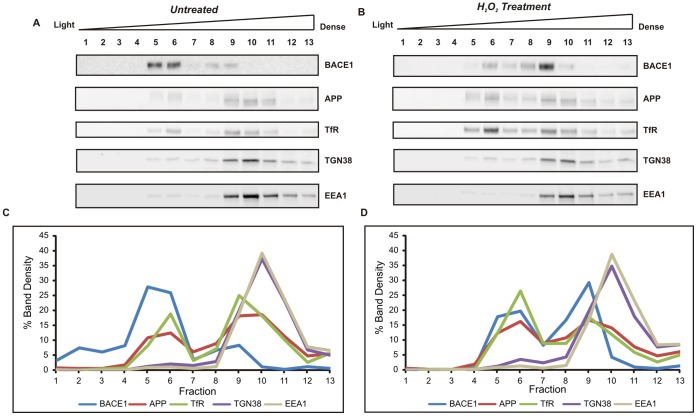
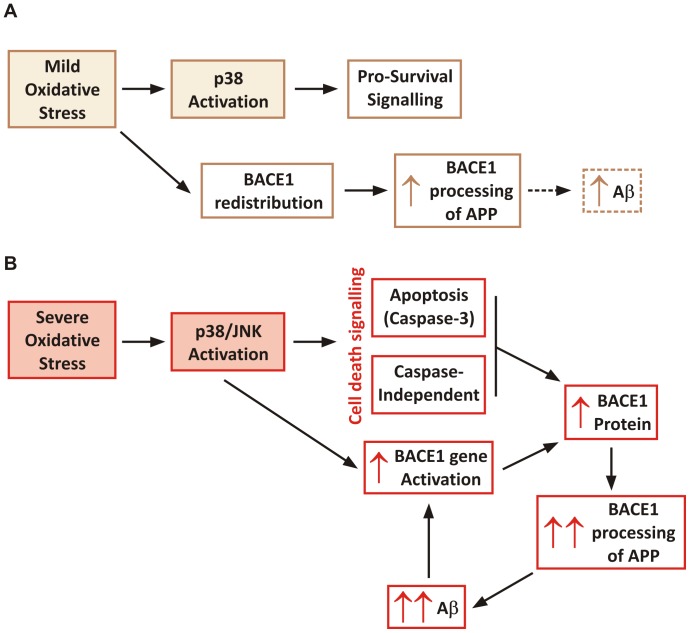
BACE1 is responsible for β-secretase cleavage of the amyloid precursor protein (APP), which represents the first step in the production of amyloid β (Aβ) peptides. Previous reports, by us and others, have indicated that the levels of BACE1 protein and activity are increased in the brain cortex of patients with Alzheimer's disease (AD). The association between oxidative stress (OS) and AD has prompted investigations that support the potentiation of BACE1 expression and enzymatic activity by OS. Here, we have established conditions to analyse the effects of mild, non-lethal OS on BACE1 in primary neuronal cultures, independently from apoptotic mechanisms that were shown to impair BACE1 turnover. Six-hour treatment of mouse primary cortical cells with 10-40 µM hydrogen peroxide did not significantly compromise cell viability but it did produce mild oxidative stress (mOS), as shown by the increased levels of reactive radical species and activation of p38 stress kinase. The endogenous levels of BACE1 mRNA and protein were not significantly altered in these conditions, whereas a toxic H2O2 concentration (100 µM) caused an increase in BACE1 protein levels. Notably, mOS conditions resulted in increased levels of the BACE1 C-terminal cleavage product of APP, β-CTF. Subcellular fractionation techniques showed that mOS caused a major rearrangement of BACE1 localization from light to denser fractions, resulting in an increased distribution of BACE1 in fractions containing APP and markers for trans-Golgi network and early endosomes. Collectively, these data demonstrate that mOS does not modify BACE1 expression but alters BACE1 subcellular compartmentalization to favour the amyloidogenic processing of APP, and thus offer new insight in the early molecular events of AD pathogenesis.
Conflict of interest statement
Figures
Similar articles
-
Relationship between ubiquilin-1 and BACE1 in human Alzheimer's disease and APdE9 transgenic mouse brain and cell-based models.Neurobiol Dis. 2016 Jan;85:187-205. doi: 10.1016/j.nbd.2015.11.005. Epub 2015 Nov 10. Neurobiol Dis. 2016. PMID: 26563932
-
BACE1 elevation engendered by GGA3 deletion increases β-amyloid pathology in association with APP elevation and decreased CHL1 processing in 5XFAD mice.Mol Neurodegener. 2018 Feb 2;13(1):6. doi: 10.1186/s13024-018-0239-7. Mol Neurodegener. 2018. PMID: 29391027 Free PMC article.
-
Amyloid-β protein (Aβ) Glu11 is the major β-secretase site of β-site amyloid-β precursor protein-cleaving enzyme 1(BACE1), and shifting the cleavage site to Aβ Asp1 contributes to Alzheimer pathogenesis.Eur J Neurosci. 2013 Jun;37(12):1962-9. doi: 10.1111/ejn.12235. Eur J Neurosci. 2013. PMID: 23773065
-
Β-site APP-cleaving enzyme 1 trafficking and Alzheimer's disease pathogenesis.J Neurochem. 2012 Mar;120(6):869-80. doi: 10.1111/j.1471-4159.2011.07623.x. Epub 2012 Jan 23. J Neurochem. 2012. PMID: 22171895 Review.
-
The β-Secretase Enzyme BACE1: A Biochemical Enigma for Alzheimer's Disease.CNS Neurol Disord Drug Targets. 2020;19(3):184-194. doi: 10.2174/1871527319666200526144141. CNS Neurol Disord Drug Targets. 2020. PMID: 32452328 Review.
Cited by
-
Serum beta-secretase 1 (BACE1) activity as candidate biomarker for late-onset Alzheimer's disease.Geroscience. 2020 Feb;42(1):159-167. doi: 10.1007/s11357-019-00127-6. Epub 2019 Nov 19. Geroscience. 2020. PMID: 31745860 Free PMC article.
-
RhoA/ROCK/GSK3β Signaling: A Keystone in Understanding Alzheimer's Disease.Curr Issues Mol Biol. 2025 Feb 14;47(2):124. doi: 10.3390/cimb47020124. Curr Issues Mol Biol. 2025. PMID: 39996845 Free PMC article. Review.
-
Traffic-related air pollutants (TRAP-PM) promote neuronal amyloidogenesis through oxidative damage to lipid rafts.Free Radic Biol Med. 2020 Feb 1;147:242-251. doi: 10.1016/j.freeradbiomed.2019.12.023. Epub 2019 Dec 26. Free Radic Biol Med. 2020. PMID: 31883973 Free PMC article.
-
Effect of Probiotic Supplementation on Cognitive Function and Metabolic Status in Alzheimer's Disease: A Randomized, Double-Blind and Controlled Trial.Front Aging Neurosci. 2016 Nov 10;8:256. doi: 10.3389/fnagi.2016.00256. eCollection 2016. Front Aging Neurosci. 2016. PMID: 27891089 Free PMC article.
-
Decoding the Role of Platelets and Related MicroRNAs in Aging and Neurodegenerative Disorders.Front Aging Neurosci. 2019 Jul 2;11:151. doi: 10.3389/fnagi.2019.00151. eCollection 2019. Front Aging Neurosci. 2019. PMID: 31312134 Free PMC article. Review.
References
-
- McLean CA, Cherny RA, Fraser FW, Fuller SJ, Smith MJ, et al. (1999) Soluble pool of Abeta amyloid as a determinant of severity of neurodegeneration in Alzheimer’s disease. Ann Neurol 46: 860–866. - PubMed
-
- Holsinger RM, McLean CA, Beyreuther K, Masters CL, Evin G (2002) Increased expression of the amyloid precursor beta-secretase in Alzheimer’s disease. Ann Neurol 51: 783–786. - PubMed
-
- Fukumoto H, Cheung BS, Hyman BT, Irizarry MC (2002) Beta-secretase protein and activity are increased in the neocortex in Alzheimer disease. Arch Neurol 59: 1381–1389. - PubMed
Publication types
MeSH terms
Substances
Grants and funding
LinkOut - more resources
Full Text Sources
Other Literature Sources
Medical
