

Combined MRI and ³¹P-MRS investigations of the ACTA1(H40Y) mouse model of nemaline myopathy show impaired muscle function and altered energy metabolism
- PMID: 23613869
- PMCID: PMC3629063
- DOI: 10.1371/journal.pone.0061517
Combined MRI and ³¹P-MRS investigations of the ACTA1(H40Y) mouse model of nemaline myopathy show impaired muscle function and altered energy metabolism
Abstract
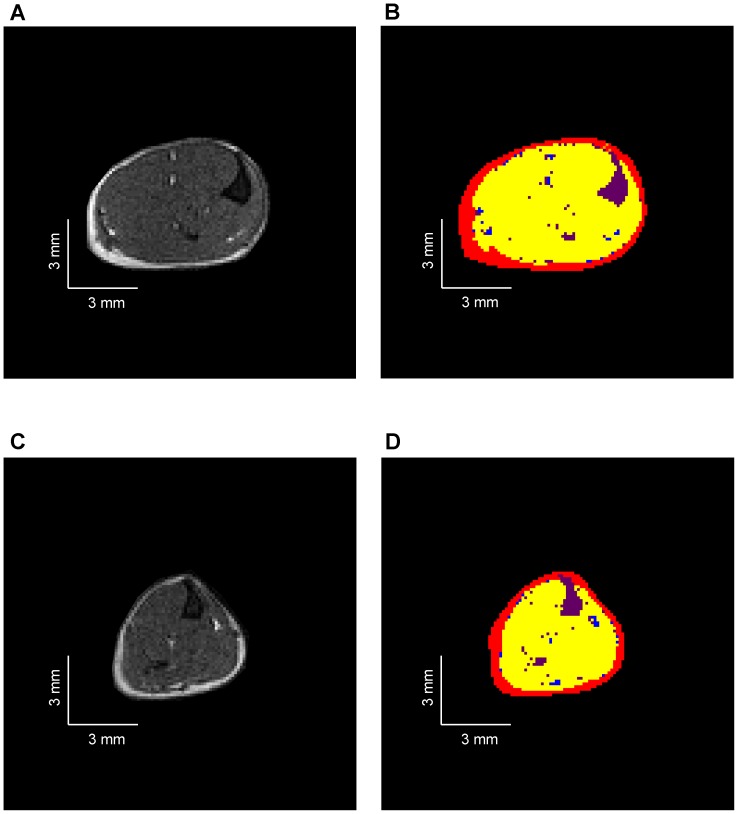
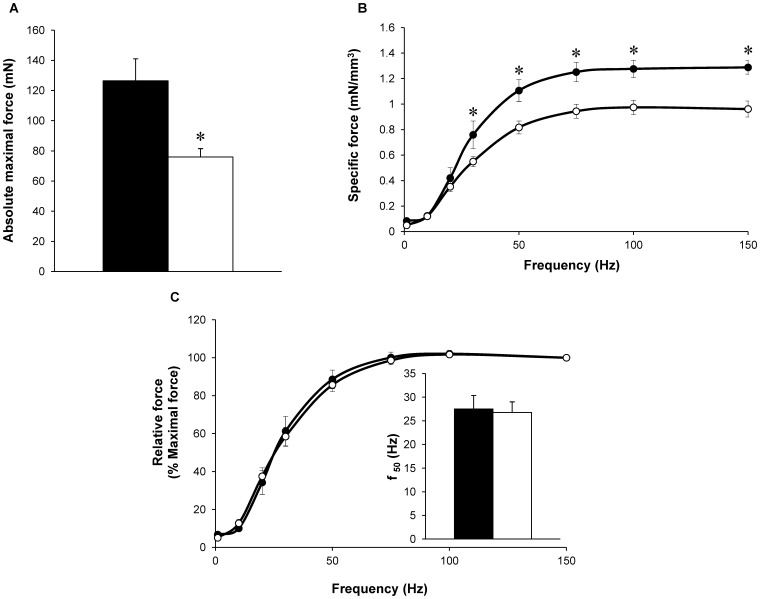
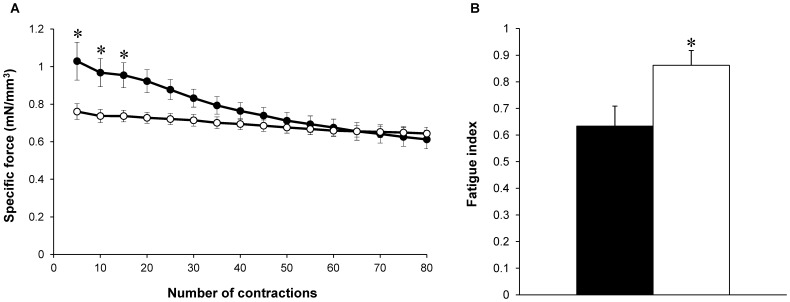
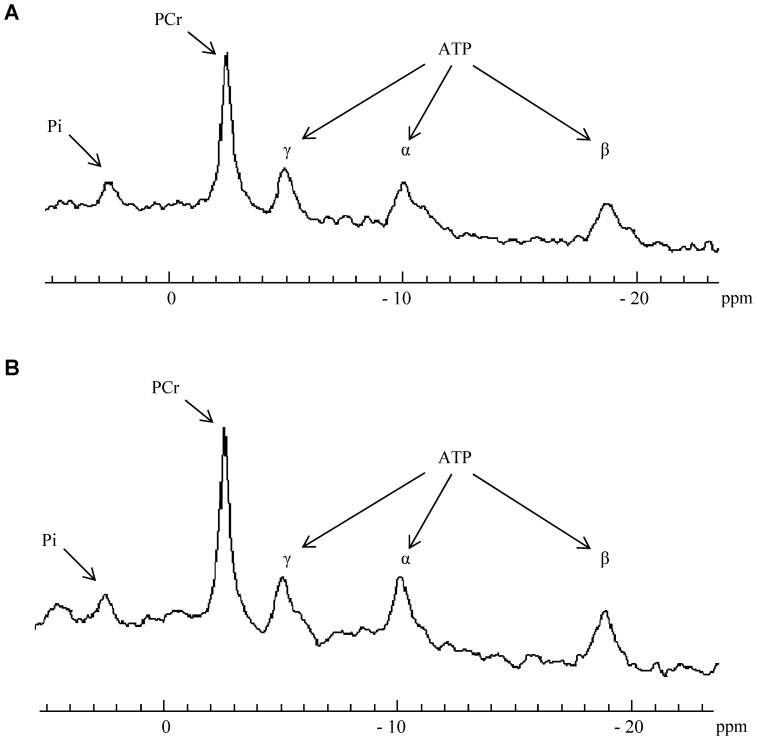
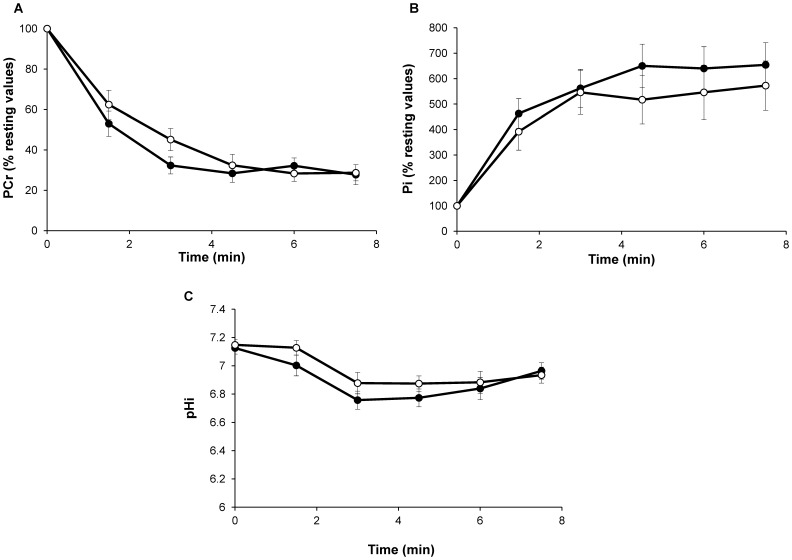
Nemaline myopathy (NM) is the most common disease entity among non-dystrophic skeletal muscle congenital diseases. Mutations in the skeletal muscle α-actin gene (ACTA1) account for ∼25% of all NM cases and are the most frequent cause of severe forms of NM. So far, the mechanisms underlying muscle weakness in NM patients remain unclear. Additionally, recent Magnetic Resonance Imaging (MRI) studies reported a progressive fatty infiltration of skeletal muscle with a specific muscle involvement in patients with ACTA1 mutations. We investigated strictly noninvasively the gastrocnemius muscle function of a mouse model carrying a mutation in the ACTA1 gene (H40Y). Skeletal muscle anatomy (hindlimb muscles and fat volumes) and energy metabolism were studied using MRI and (31)Phosphorus magnetic resonance spectroscopy. Skeletal muscle contractile performance was investigated while applying a force-frequency protocol (from 1-150 Hz) and a fatigue protocol (80 stimuli at 40 Hz). H40Y mice showed a reduction of both absolute (-40%) and specific (-25%) maximal force production as compared to controls. Interestingly, muscle weakness was associated with an improved resistance to fatigue (+40%) and an increased energy cost. On the contrary, the force frequency relationship was not modified in H40Y mice and the extent of fatty infiltration was minor and not different from the WT group. We concluded that the H40Y mouse model does not reproduce human MRI findings but shows a severe muscle weakness which might be related to an alteration of intrinsic muscular properties. The increased energy cost in H40Y mice might be related to either an impaired mitochondrial function or an alteration at the cross-bridges level. Overall, we provided a unique set of anatomic, metabolic and functional biomarkers that might be relevant for monitoring the progression of NM disease but also for assessing the efficacy of potential therapeutic interventions at a preclinical level.
Conflict of interest statement
Figures
References
-
- Schnell C, Kan A, North KN (2000) ‘An artefact gone awry’: identification of the first case of nemaline myopathy by Dr R.D.K. Reye. Neuromuscul Disord. 10: 307–312. - PubMed
-
- Sanoudou D, Beggs AH (2001) Clinical and genetic heterogeneity in nemaline myopathy–a disease of skeletal muscle thin filaments. Trends Mol Med. 7: 362–368. - PubMed
-
- Wallgren-Pettersson C, Sewry CA, Nowak KJ, Laing NG (2011) Nemaline myopathies. Semin Pediatr Neurol. 18: 230–238. - PubMed
Publication types
MeSH terms
Substances
LinkOut - more resources
Full Text Sources
Other Literature Sources
Medical
Molecular Biology Databases
