. 2013 Apr 17;8(4):e61558.
doi: 10.1371/journal.pone.0061558. Print 2013.

Transcriptome profiling of the murine testis during the first wave of spermatogenesis

Affiliations

Transcriptome profiling of the murine testis during the first wave of spermatogenesis

Asta Laiho et al. PLoS One. .

Abstract

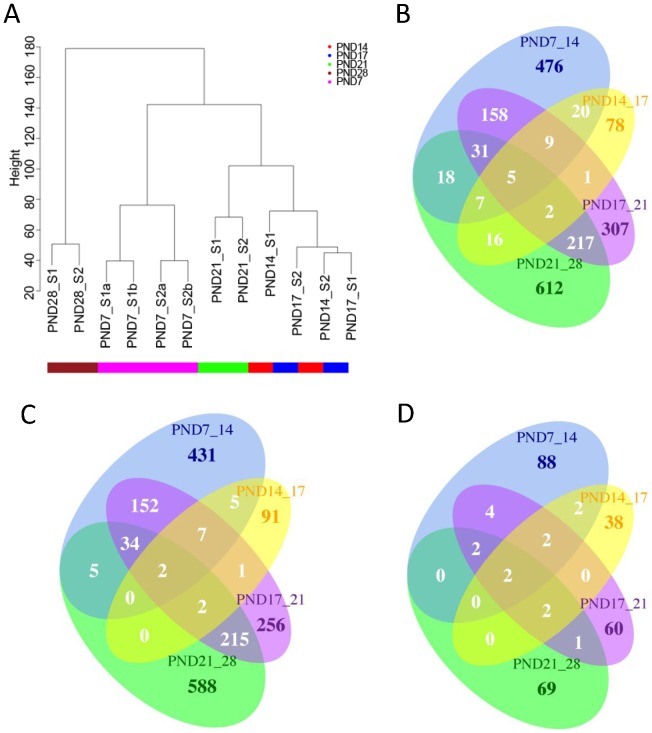
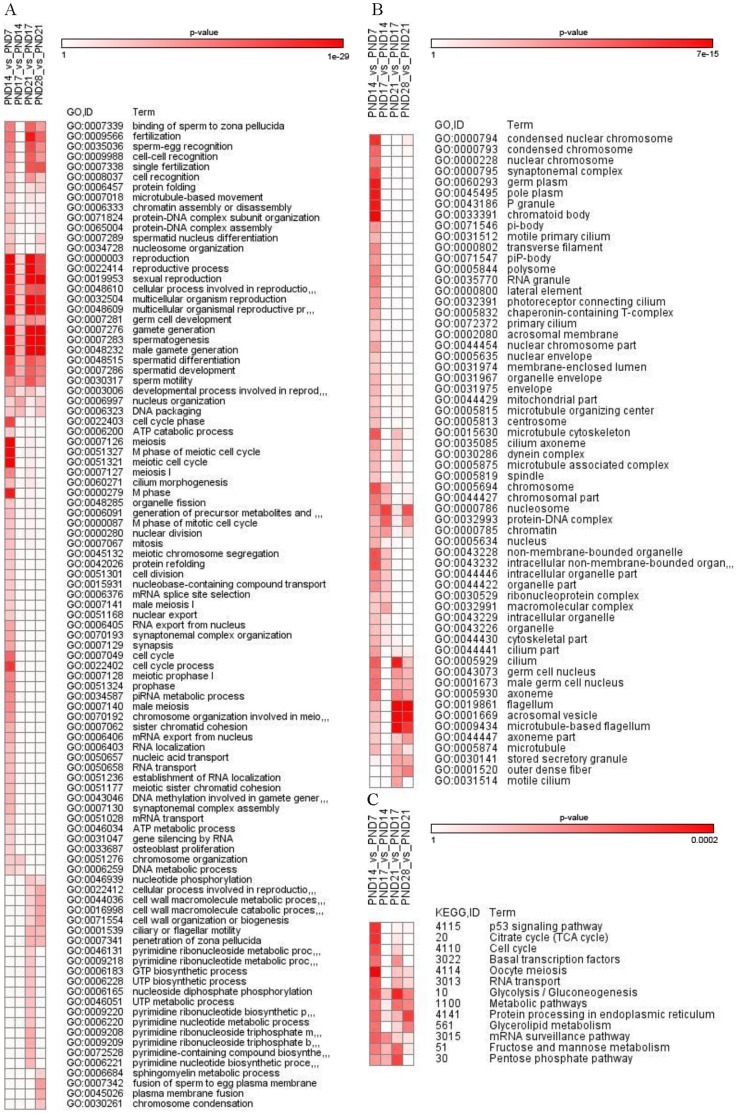
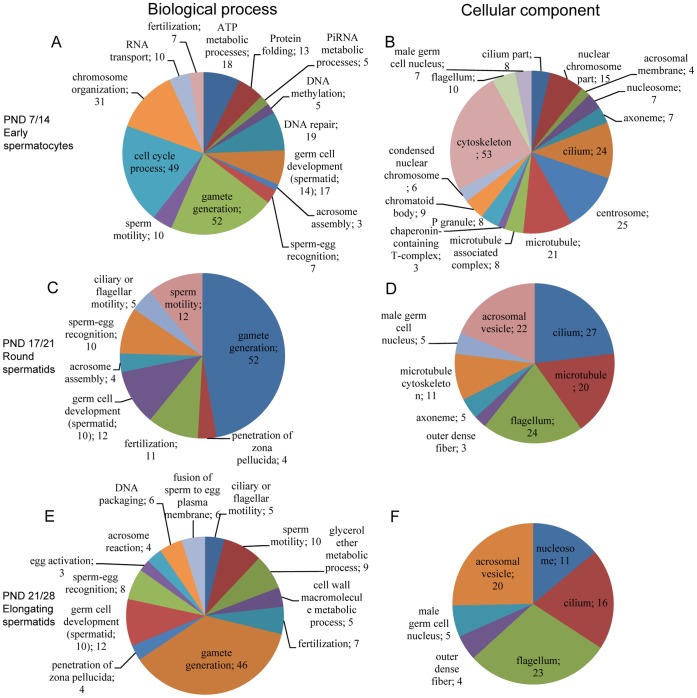
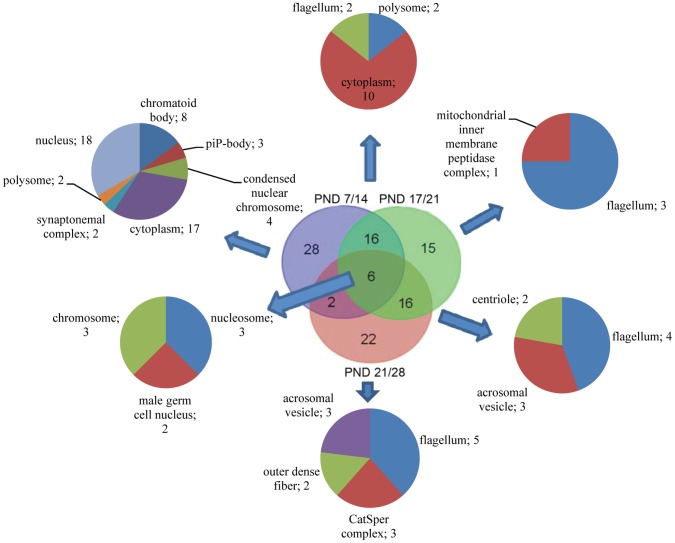
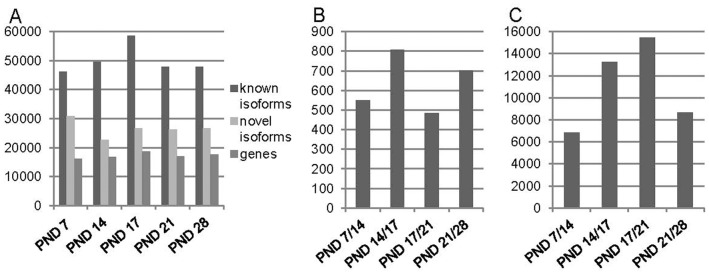
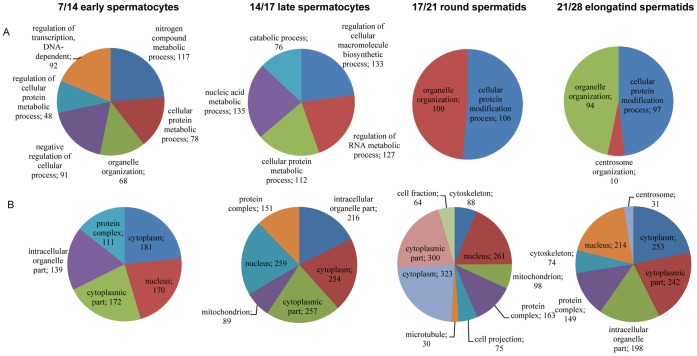
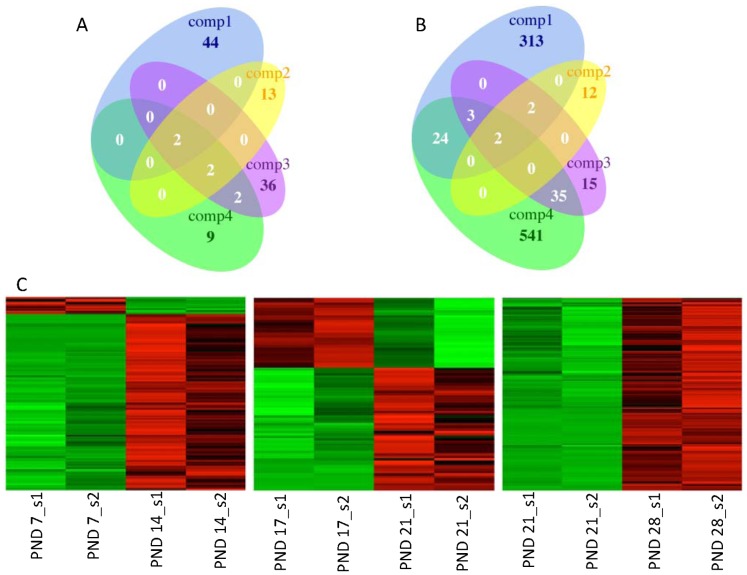
Correct gene expression patterns form the basis for male germ cell differentiation and male fertility. Although previous studies have elucidated the importance of testis specific gene expression, the exact transcripts and comprehensive gene expression patterns remain unknown. Large scale sequencing techniques have enabled cost effective analysis of gene expression and isoform studies. Using the SOLiD 4 next-generation sequencing platform we have investigated the gene expression patterns at five different time points during the first wave on murine spermatogenesis. Our results highlight the upregulation of spermatogenesis related biological processes and associated cellular components. Elucidation of differential gene expression at important time points during the sperm development emphasizes the importance of correct timing of gene expression within biological processes. Differential gene level expression was analyzed with R/Bioconductor's Limma package and isoform analysis was conducted with the Cufflinks pipeline. At gene level total of 2494 differentially expressed genes were identified and Cufflinks characterized over 160,000 gene isoforms, of which 29% were novel transcripts assigned to known genes. Isoforms were detected for 57% of expressed genes and in a total over 26,000 genes were expressed in the testis. Differential promoter and transcription start site usage appears also to play a role in regulation of gene expression during spermatogenesis. Furthermore, we identified 947 upregulated long non-coding RNAs during the first wave of spermatogenesis. These RNAs appeared to be highly specific to different time points. Transcriptomic analysis of testis tissue samples is highly informative due to the large number of expressed genes and identified isoforms. Our study provides a very valuable basis for investigation of gene isoforms and regulation and factors contributing to male fertility.


Conflict of interest statement

Competing Interests: The authors have declared that no competing interests exist.

Figures

Figure 1
Figure 1. Clustering of sample groups and overlapping DE genes.
A. Hierarchical clustering for the normalized data. Biological replicate samples cluster closely together. Sample groups PND28 and PND7 are more distant to other groups and PND14 and PND17 are similar to each other based on the gene expression differences. B. Total number of overlapping DE genes between comparisons. C. Agreeing and overlapping upregulated genes between comparisons. D. Agreeing and overlapping downregulated genes between comparisons.
Figure 2
Figure 2. Highest ranked GO terms (p<0.01) with differential expression between sample groups for GO biological processes (A) and cellular components (B) and for KEGG pathways (C).
The relative significance of term enrichment is indicated by levels of red shading (the lower the p-value the darker shade of red colour). Heat map was produced with GENE-E (http://www.broadinstitute.org/cancer/software/GENE-E/) using pearson’s correlation metrics and average linkage distance metrics.
Figure 3
Figure 3. Enriched biological process and cellular component GO terms among upregulated genes.
Comparison of PND14/17 is not presented due to low number of DE genes. A. PND 7/14 biological processes, B. PND 7/14 cellular component, C. PND 17/21 biological processes, D. PND 17/21 cellular component, E. PND 21/28 biological processes and F. PND 21/28 cellular component. Only lower level GO terms are shown.
Figure 4
Figure 4. Venn diagram and enriched cellular complex GO terms of upregulated genes in biological process GO term gamete generation.
Only lower level GO terms are shown.
Figure 5
Figure 5. Gene and isoform counts and promoter and transcription start site usage in sample groups.
A. Expressed gene, known and novel isoform counts at different time points during the first wave of spermatogenesis. FPKM >1. B. Differential promoter usage in all sample group comparisons. C. Differential transcription start site usage between all sample groups. The comparisons in chronological order during the first wave of spermatogenesis are indicated in black (B and C).
Figure 6
Figure 6. Enriched biological process (A) and cellular component (B) GO terms of genes with differential promoter usage between sample groups (p<10−6).
Only lower level terms are shown.
Figure 7
Figure 7. Differentially expressed lncRNAs.
A. Venn diagram for all identified downregulated DE lncRNAs. B. Venn diagram for all identified upregulated DE lncRNAs. Comp1 =  PND7/14, Comp2 =  PND14/17, Comp3 =  PND17/21, Comp4 =  PND21/28. C. Heat maps for filtered (p<0.01, FC >2) DE lncRNAs between comparisons. Upregulated genes are indicated in red and downregulated in green.

References

    1. Oakberg EF (1957) Duration of spermatogenesis in the mouse. Nature 180: 1137–1138. - PubMed
    1. Tanaka H, Baba T (2005) Gene expression in spermiogenesis. Cell Mol Life Sci 62: 344–354. - PMC - PubMed
    1. Bellve AR, Cavicchia JC, Millette CF, O'Brien DA, Bhatnagar YM, et al. (1977) Spermatogenic cells of the prepuberal mouse. isolation and morphological characterization. J Cell Biol 74: 68–85. - PMC - PubMed
    1. Steger K (1999) Transcriptional and translational regulation of gene expression in haploid spermatids. Anat Embryol (Berl) 199: 471–487. - PubMed
    1. Sassone-Corsi P (1998) Coupling gene expression to cAMP signalling: Role of CREB and CREM. Int J Biochem Cell Biol 30: 27–38. - PubMed

Publication types

MeSH terms