

Feasibility of MR metabolomics for immediate analysis of resection margins during breast cancer surgery
- PMID: 23613877
- PMCID: PMC3629170
- DOI: 10.1371/journal.pone.0061578
Feasibility of MR metabolomics for immediate analysis of resection margins during breast cancer surgery
Abstract
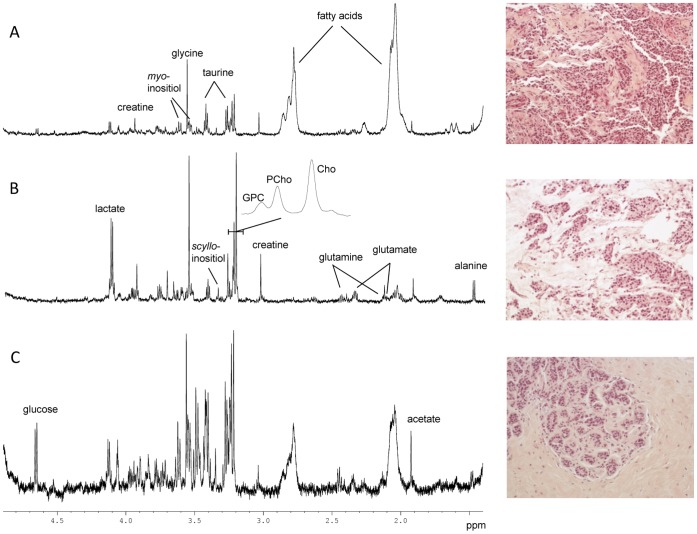
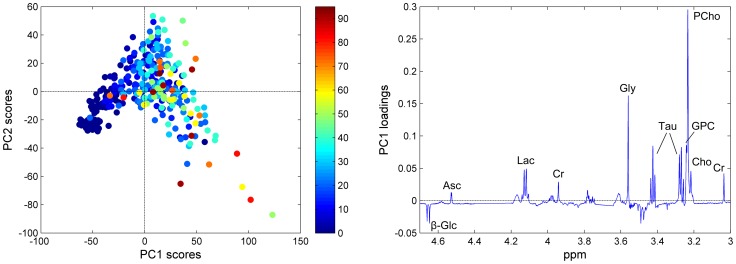
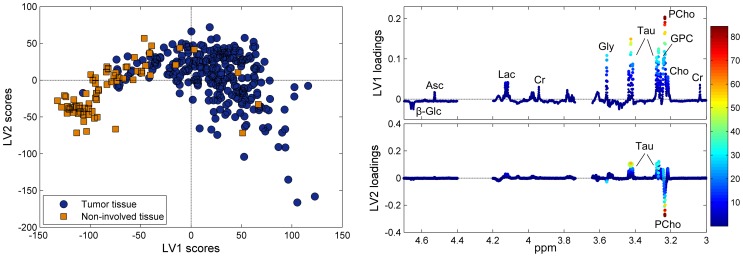
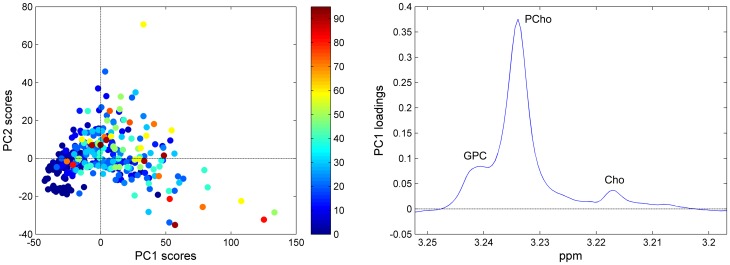
In this study, the feasibility of high resolution magic angle spinning (HR MAS) magnetic resonance spectroscopy (MRS) of small tissue biopsies to distinguish between tumor and non-involved adjacent tissue was investigated. With the current methods, delineation of the tumor borders during breast cancer surgery is a challenging task for the surgeon, and a significant number of re-surgeries occur. We analyzed 328 tissue samples from 228 breast cancer patients using HR MAS MRS. Partial least squares discriminant analysis (PLS-DA) was applied to discriminate between tumor and non-involved adjacent tissue. Using proper double cross validation, high sensitivity and specificity of 91% and 93%, respectively was achieved. Analysis of the loading profiles from both principal component analysis (PCA) and PLS-DA showed the choline-containing metabolites as main biomarkers for tumor content, with phosphocholine being especially high in tumor tissue. Other indicative metabolites include glycine, taurine and glucose. We conclude that metabolic profiling by HR MAS MRS may be a potential method for on-line analysis of resection margins during breast cancer surgery to reduce the number of re-surgeries and risk of local recurrence.
Conflict of interest statement
Figures
Similar articles
-
Magnetic resonance metabolic profiling of breast cancer tissue obtained with core needle biopsy for predicting pathologic response to neoadjuvant chemotherapy.PLoS One. 2013 Dec 19;8(12):e83866. doi: 10.1371/journal.pone.0083866. eCollection 2013. PLoS One. 2013. PMID: 24367616 Free PMC article.
-
Predicting long-term survival and treatment response in breast cancer patients receiving neoadjuvant chemotherapy by MR metabolic profiling.NMR Biomed. 2012 Feb;25(2):369-78. doi: 10.1002/nbm.1762. Epub 2011 Aug 8. NMR Biomed. 2012. PMID: 21823183
-
The Role of High-Resolution Magic Angle Spinning 1H Nuclear Magnetic Resonance Spectroscopy for Predicting the Invasive Component in Patients with Ductal Carcinoma In Situ Diagnosed on Preoperative Biopsy.PLoS One. 2016 Aug 25;11(8):e0161038. doi: 10.1371/journal.pone.0161038. eCollection 2016. PLoS One. 2016. PMID: 27560937 Free PMC article.
-
Clinical applications of breast cancer metabolomics using high-resolution magic angle spinning proton magnetic resonance spectroscopy (HRMAS 1H MRS): systematic scoping review.Metabolomics. 2019 Nov 6;15(11):148. doi: 10.1007/s11306-019-1611-5. Metabolomics. 2019. PMID: 31696341
-
Metabolic Portraits of Breast Cancer by HR MAS MR Spectroscopy of Intact Tissue Samples.Metabolites. 2017 May 16;7(2):18. doi: 10.3390/metabo7020018. Metabolites. 2017. PMID: 28509845 Free PMC article. Review.
Cited by
-
Glycine: a non-invasive imaging biomarker to aid magnetic resonance spectroscopy in the prediction of survival in paediatric brain tumours.Oncotarget. 2018 Apr 10;9(27):18858-18868. doi: 10.18632/oncotarget.24789. eCollection 2018 Apr 10. Oncotarget. 2018. PMID: 29721167 Free PMC article.
-
Magnetic Resonance Imaging (MRI) and MR Spectroscopic Methods in Understanding Breast Cancer Biology and Metabolism.Metabolites. 2022 Mar 27;12(4):295. doi: 10.3390/metabo12040295. Metabolites. 2022. PMID: 35448482 Free PMC article. Review.
-
Metabolic profiling of the three neural derived embryonal pediatric tumors retinoblastoma, neuroblastoma and medulloblastoma, identifies distinct metabolic profiles.Oncotarget. 2018 Jan 11;9(13):11336-11351. doi: 10.18632/oncotarget.24168. eCollection 2018 Feb 16. Oncotarget. 2018. PMID: 29541417 Free PMC article.
-
Current Status and Future Prospects of Clinically Exploiting Cancer-specific Metabolism-Why Is Tumor Metabolism Not More Extensively Translated into Clinical Targets and Biomarkers?Int J Mol Sci. 2019 Mar 19;20(6):1385. doi: 10.3390/ijms20061385. Int J Mol Sci. 2019. PMID: 30893889 Free PMC article. Review.
-
Metabolic Footprints and Molecular Subtypes in Breast Cancer.Dis Markers. 2017;2017:7687851. doi: 10.1155/2017/7687851. Epub 2017 Dec 24. Dis Markers. 2017. PMID: 29434411 Free PMC article. Review.
References
-
- (2011) Cancer in Norway 2009 - Cancer incidence, mortality, survival and prevalence in Norway. Oslo: Cancer Registry of Norway.
-
- Lovrics PJ, Cornacchi SD, Farrokhyar F, Garnett A, Chen V, et al. (2009) The relationship between surgical factors and margin status after breast-conservation surgery for early stage breast cancer. Am J Surg 197: 740–746. - PubMed
-
- Fiehn O (2002) Metabolomics–the link between genotypes and phenotypes. Plant Mol Biol 48: 155–171. - PubMed
Publication types
MeSH terms
Substances
LinkOut - more resources
Full Text Sources
Other Literature Sources
Medical
