

On the usage of linear regression models to reconstruct limb kinematics from low frequency EEG signals
- PMID: 23613992
- PMCID: PMC3629197
- DOI: 10.1371/journal.pone.0061976
On the usage of linear regression models to reconstruct limb kinematics from low frequency EEG signals
Abstract
Several works have reported on the reconstruction of 2D/3D limb kinematics from low-frequency EEG signals using linear regression models based on positive correlation values between the recorded and the reconstructed trajectories. This paper describes the mathematical properties of the linear model and the correlation evaluation metric that may lead to a misinterpretation of the results of this type of decoders. Firstly, the use of a linear regression model to adjust the two temporal signals (EEG and velocity profiles) implies that the relevant component of the signal used for decoding (EEG) has to be in the same frequency range as the signal to be decoded (velocity profiles). Secondly, the use of a correlation to evaluate the fitting of two trajectories could lead to overly-optimistic results as this metric is invariant to scale. Also, the correlation has a non-linear nature that leads to higher values for sinus/cosinus-like signals at low frequencies. Analysis of these properties on the reconstruction results was carried out through an experiment performed in line with previous studies, where healthy participants executed predefined reaching movements of the hand in 3D space. While the correlations of limb velocity profiles reconstructed from low-frequency EEG were comparable to studies in this domain, a systematic statistical analysis revealed that these results were not above the chance level. The empirical chance level was estimated using random assignments of recorded velocity profiles and EEG signals, as well as combinations of randomly generated synthetic EEG with recorded velocity profiles and recorded EEG with randomly generated synthetic velocity profiles. The analysis shows that the positive correlation results in this experiment cannot be used as an indicator of successful trajectory reconstruction based on a neural correlate. Several directions are herein discussed to address the misinterpretation of results as well as the implications on previous invasive and non-invasive works.
Conflict of interest statement
Figures
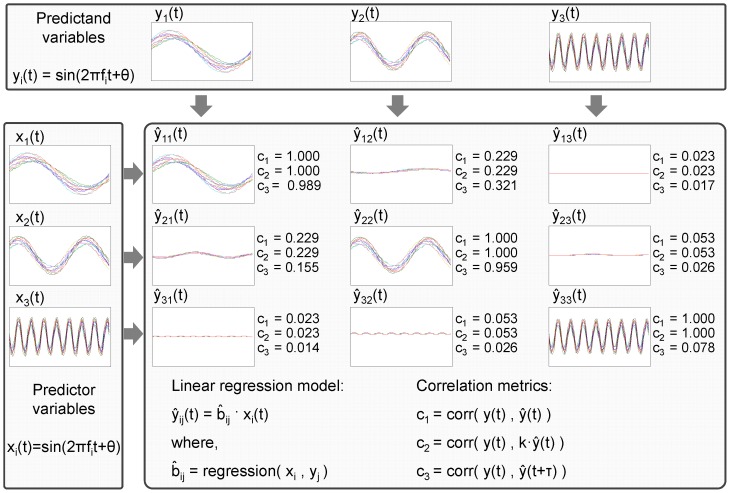
 representing predictor variables at
  ,
,  and
and  . The upper panel shows the predictands variables
  , which are identical to the predictors (i.e. they correspond to a linear model
  with
with  ). Each dataset contains
  signals and 90% of them was used to train a linear regression model while the remaining 10% was used to evaluate performance. The linear regression model was used predict each dataset from itself and the others. For each case, the reconstructed signals and correlation results are shown in the middle panel. The effect of the artifact is revealed in the usage of the regression model and correlation to validate datasets 1 and 2, where the correlation values are approximately 0.23, despite having different frequencies.
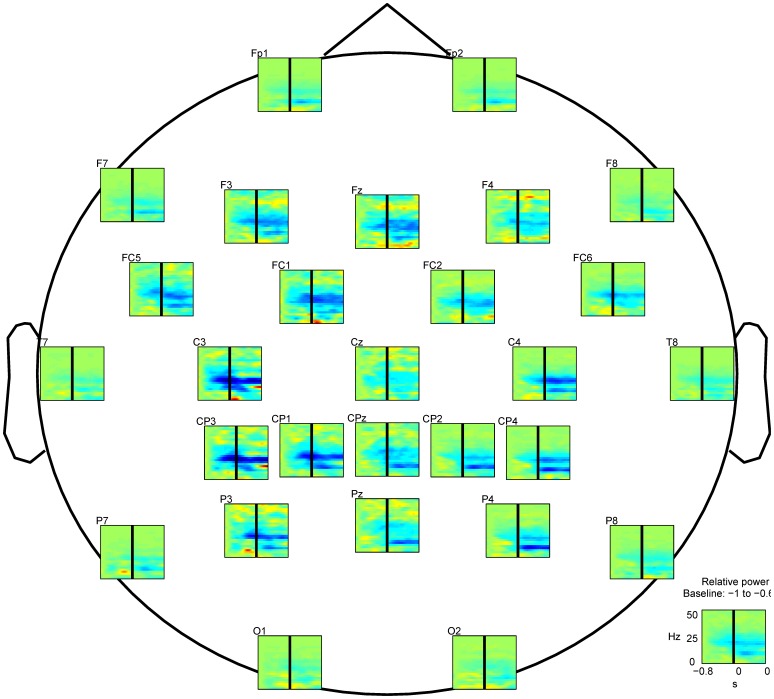
 s (solid black line in all graphs). Sensors above the contralateral and ipsilateral motor areas revealed a power increase in the slow wave range (
 4)Hz and a de-synchronization in the
  (8-12)Hz and
  (14-30)Hz frequency bands. Graph at the right lower corner represents the average across-sensors relative power spectra changes of the recorded EEG.
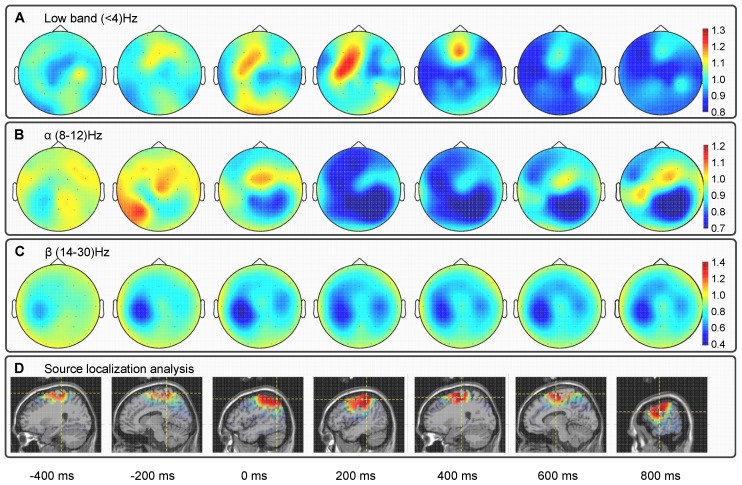
 300 ms prior to the movement onset and remained until
  200ms relative to the movement onset. The de-synchronization in the
  and
and  bands started
  400 ms prior to the movement onset and remained until the end of the movement. (d) The source localization of the underlying EEG activity averaged for all trials and participants revealed a network of activation in the motor-related and neighboring areas prior to the movement onset, and the activation of the contralateral motor cortex during the execution of the movement.
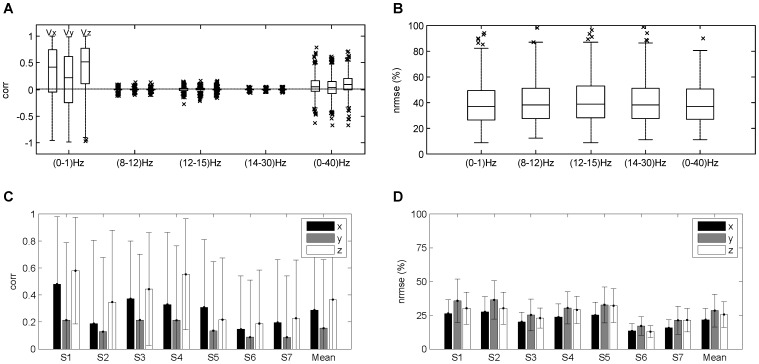
 ,
,  and
and  frequency bands, the distributions of
  have a significant zero-median distribution in X-, Y- and Z-dimension of the velocity. For the very low
  and the (0–40) Hz frequency bands the distributions of
  were positive and significantly different from zero, although the medians of the distributions obtained in the very low
  are notably higher than for the (0–40) Hz band. These results support the selection of the very low
  band to further study the decoding of hand velocity. (C,D) Decoding results using the very low
  (0–1) Hz frequency band. mean
 std values of
  and
and  in the decoding of hand velocity profiles using the very low frequency band for all participants plus overall mean.
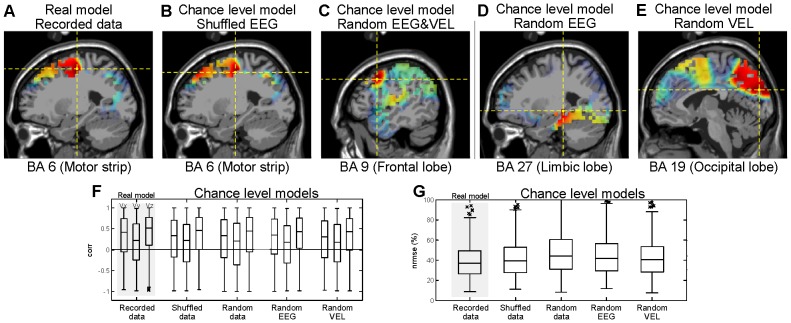
 and (G)
  for all participants for the real model (Recorded data) and the chance level models (Shuffled data, Random EEG&VEL, Random EEG and Artificial VEL). These results revealed no significant differences between the real model and the chance level models.
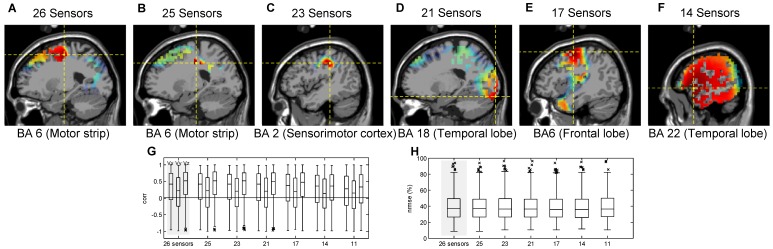
 and (H)
  for all participants for decoding models built by progressive elimination of electrodes. These results indicate that significant similar results were obtained in the decoding models that utilize 26, 25, 23, 21 and 17 electrodes, but the results were significantly different and lower when utilizing 14 and 11 electrodes.
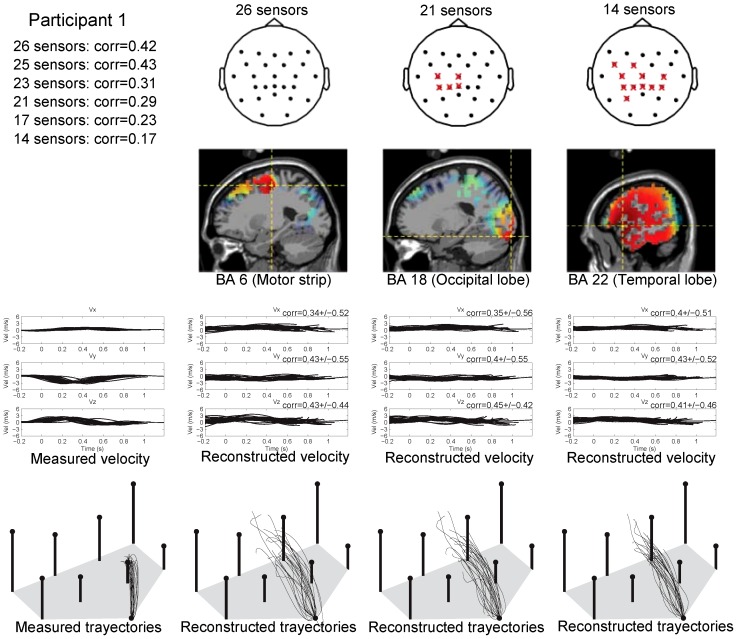
References
-
- Wolpaw JR (2010) Brain-computer interface research comes of age: traditional assumptions meet emerging realities. Journal of Motor Behavior 42: 351–353. - PubMed
Publication types
MeSH terms
LinkOut - more resources
Full Text Sources
Other Literature Sources
