. 2013 Apr 16;8(4):e61991.
doi: 10.1371/journal.pone.0061991. Print 2013.

Acidosis activation of the proton-sensing GPR4 receptor stimulates vascular endothelial cell inflammatory responses revealed by transcriptome analysis

Affiliations

Acidosis activation of the proton-sensing GPR4 receptor stimulates vascular endothelial cell inflammatory responses revealed by transcriptome analysis

Lixue Dong et al. PLoS One. .

Abstract

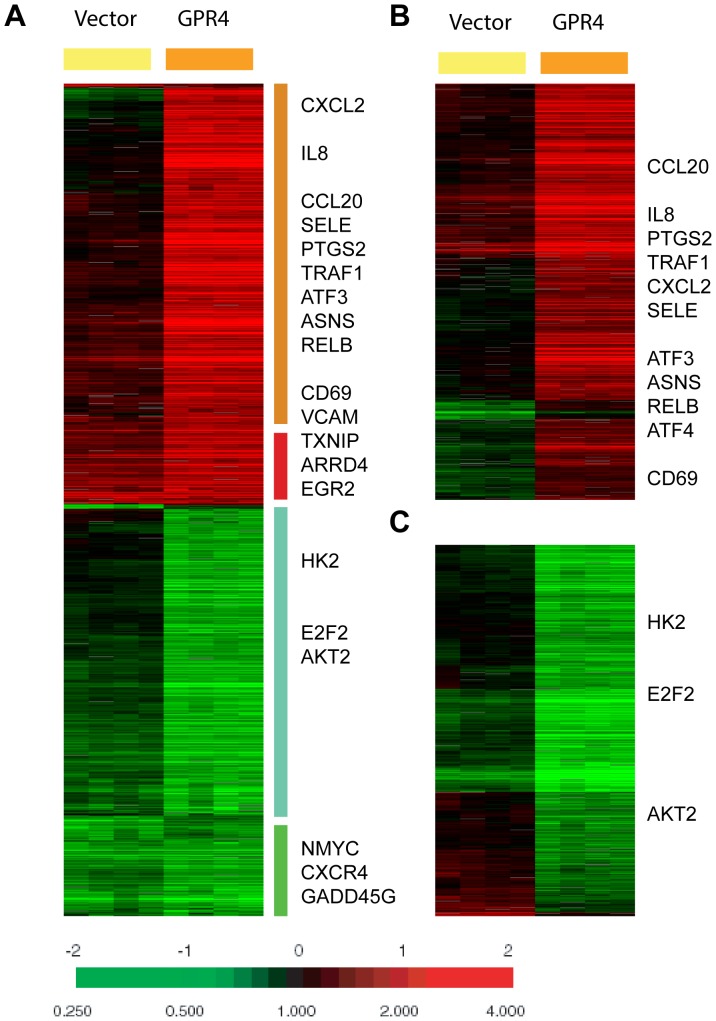
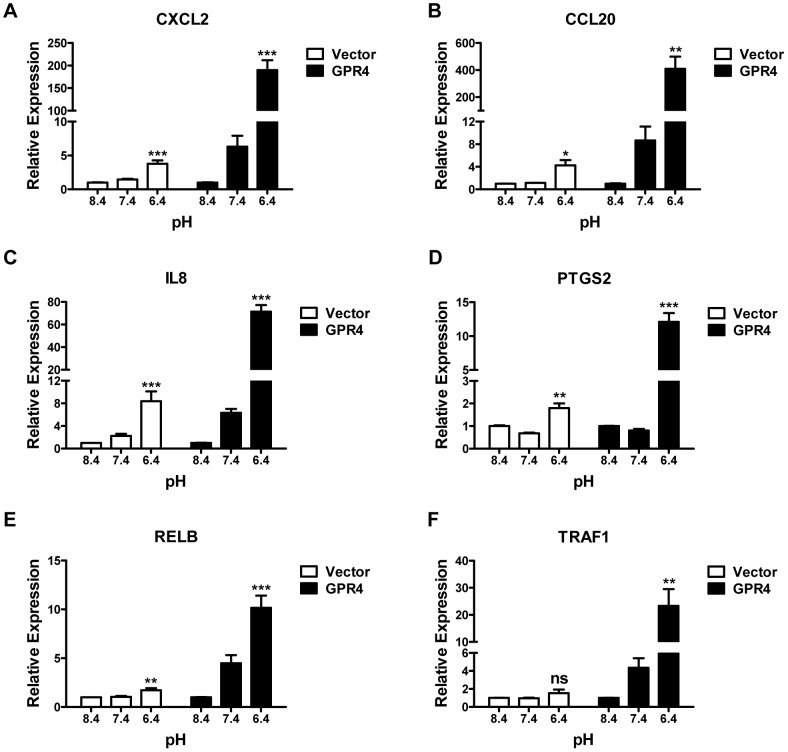
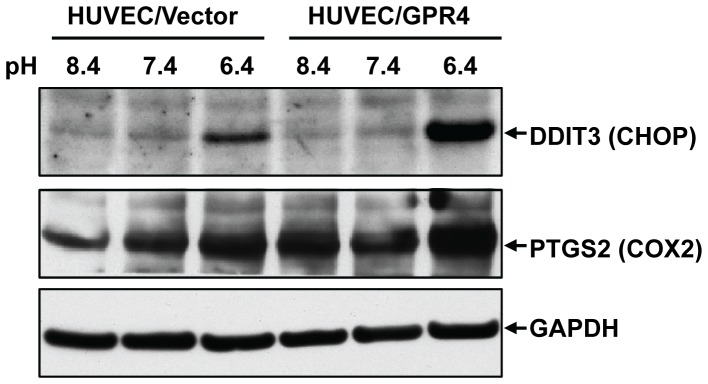
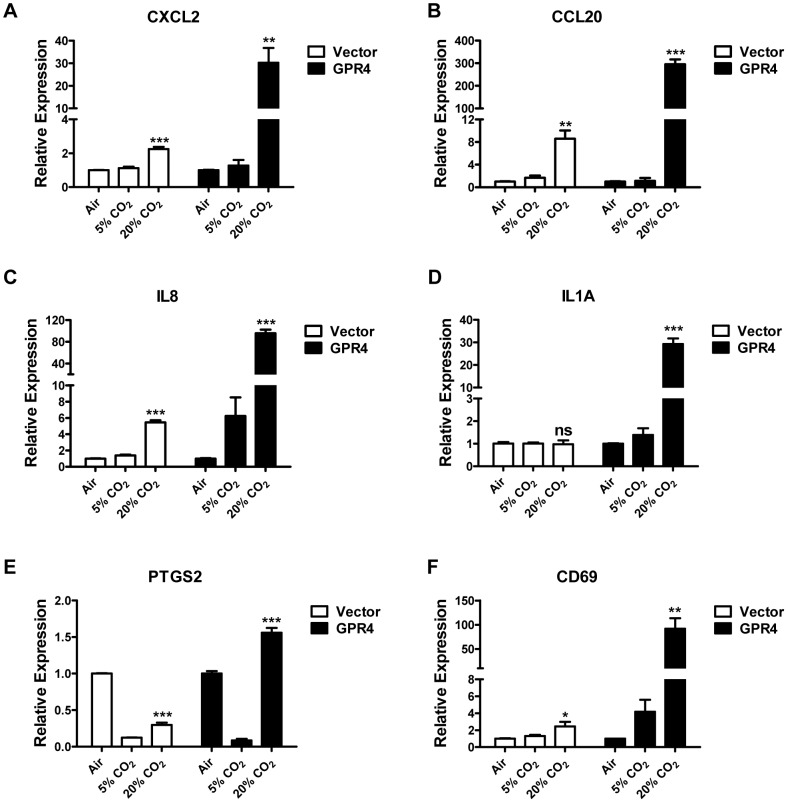
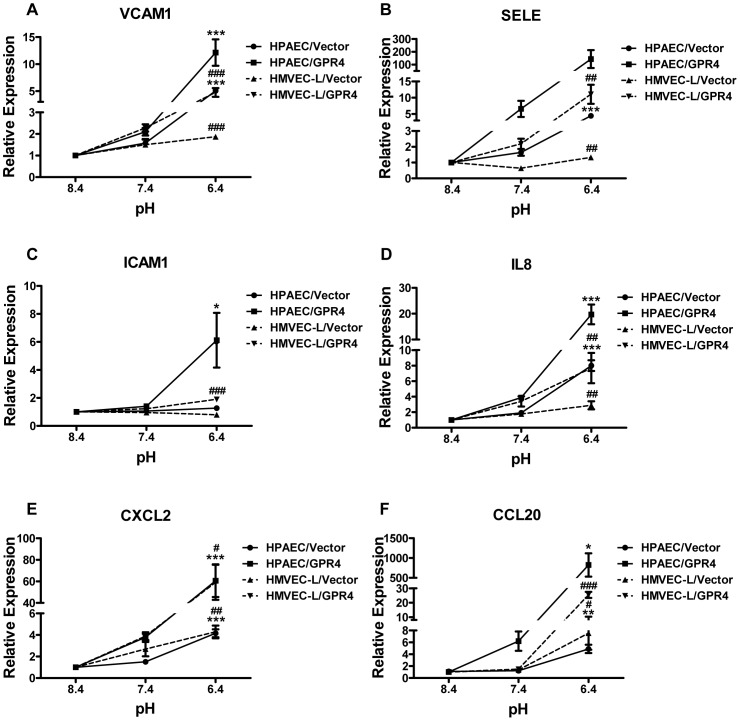
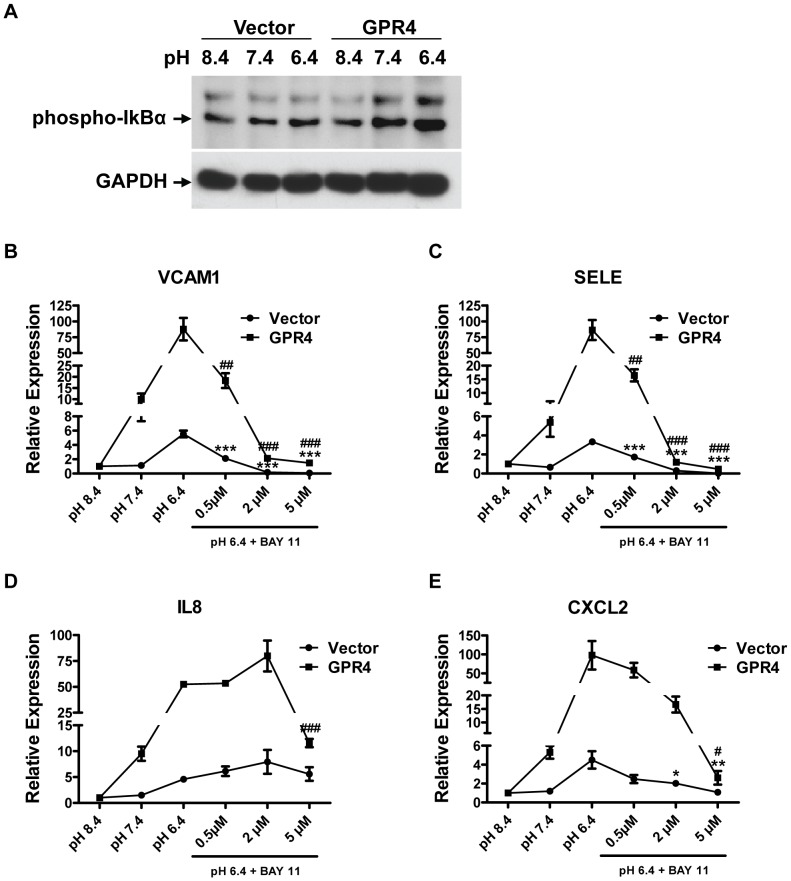
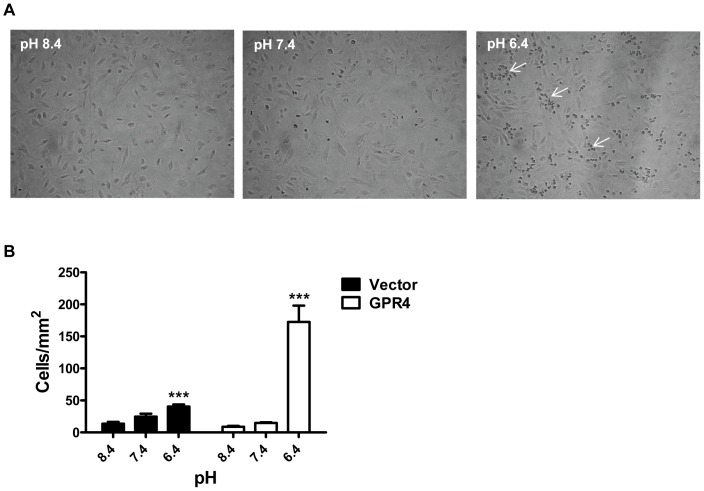
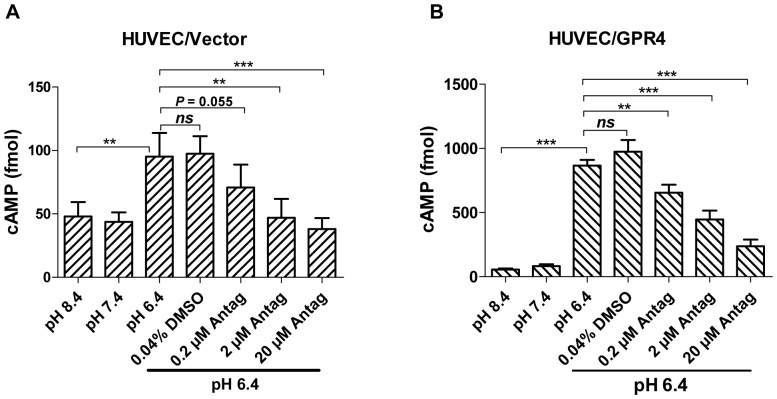
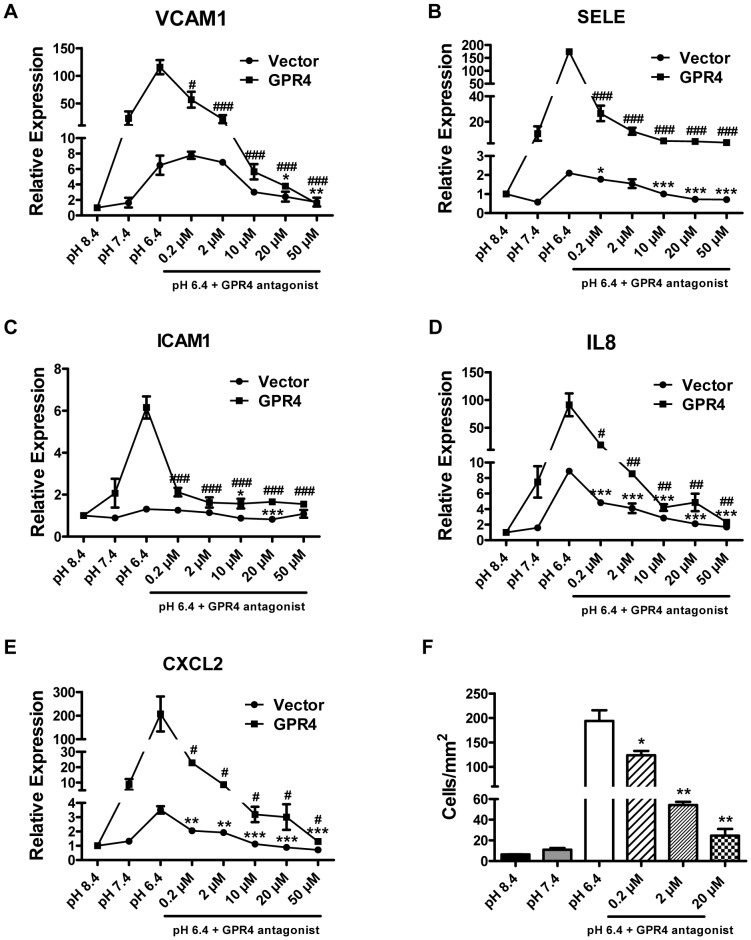
Acidic tissue microenvironment commonly exists in inflammatory diseases, tumors, ischemic organs, sickle cell disease, and many other pathological conditions due to hypoxia, glycolytic cell metabolism and deficient blood perfusion. However, the molecular mechanisms by which cells sense and respond to the acidic microenvironment are not well understood. GPR4 is a proton-sensing receptor expressed in endothelial cells and other cell types. The receptor is fully activated by acidic extracellular pH but exhibits lesser activity at the physiological pH 7.4 and minimal activity at more alkaline pH. To delineate the function and signaling pathways of GPR4 activation by acidosis in endothelial cells, we compared the global gene expression of the acidosis response in primary human umbilical vein endothelial cells (HUVEC) with varying level of GPR4. The results demonstrated that acidosis activation of GPR4 in HUVEC substantially increased the expression of a number of inflammatory genes such as chemokines, cytokines, adhesion molecules, NF-κB pathway genes, and prostaglandin-endoperoxidase synthase 2 (PTGS2 or COX-2) and stress response genes such as ATF3 and DDIT3 (CHOP). Similar GPR4-mediated acidosis induction of the inflammatory genes was also noted in other types of endothelial cells including human lung microvascular endothelial cells and pulmonary artery endothelial cells. Further analyses indicated that the NF-κB pathway was important for the acidosis/GPR4-induced inflammatory gene expression. Moreover, acidosis activation of GPR4 increased the adhesion of HUVEC to U937 monocytic cells under a flow condition. Importantly, treatment with a recently identified GPR4 antagonist significantly reduced the acidosis/GPR4-mediated endothelial cell inflammatory response. Taken together, these results show that activation of GPR4 by acidosis stimulates the expression of a wide range of inflammatory genes in endothelial cells. Such inflammatory response can be suppressed by GPR4 small molecule inhibitors and hold potential therapeutic value.


Conflict of interest statement

Competing Interests: The authors have read the journal's policy and have the following conflicts: Li Yang is the inventor of a patent “Function of GPR4 in vascular inflammatory response to acidosis and related methods” (US 8207139 B2) that is related to the data described in this manuscript, but there is no current financial interest. This does not alter the authors' adherence to all the PLOS ONE policies on sharing data and materials.

Figures

Figure 1
Figure 1. The global gene expression of acidosis response of HUVEC.
(A) The gene expression response of HUVECs transduced with the control vector or the GPR4 expression construct is shown. 1208 probes were selected by the criteria of at least three observations with at least three fold changes and arranged by hierarchical clustering. Clusters of genes which are induced or repressed in a GPR4-depedent or -independent fashion are shown with the names of selected genes. (B, C) The gene expression responses of the probes selected by SAM to be 941 GPR4-induced (B) or 679 GPR4-repressed (C) are depicted with the names of selected genes shown.
Figure 2
Figure 2. Validation of microarray by real-time RT-PCR.
HUVECs transduced with the control vector (Vector, white bars), or the GPR4 expression construct (GPR4, dark bars) were treated with EGM-2/HEM media at pH 8.4, 7.4, or 6.4 for 5 h. Total RNA was isolated and cDNA was synthesized. Real-time RT-PCR quantification of mRNA levels of CXCL2 (A), CCL20 (B), IL8 (C), PTGS2 (D), RELB (E) and TRAF1 (F) was performed. Ct values were normalized to the housekeeping gene GAPDH. The expression level of the target gene in HUVEC/Vector or HUVEC/GPR4 cells at pH 8.4 was set as 1. Error bars indicate the mean ± SEM. *, P<0.05; **, P<0.01; ***, P<0.001; ns, not significant (P>0.05); compared with the pH 8.4 groups. The results shown are the average of at least two biological repeats.
Figure 3
Figure 3. Validation of gene expression at the protein level by Western blotting.
HUVEC/Vector and HUVEC/GPR4 cells were treated with EGM-2/HEM media at pH 8.4, 7.4, or 6.4 for 5 h. Cells were then lysed with RIPA buffer, and total proteins were separated by electrophoresis and transferred to nitrocellulose membrane. Protein expression of DDIT3 (CHOP) and PTGS2 (COX-2) was detected using the specific antibodies. The target bands are indicated by an arrow. Western blot of GAPDH serves as a loading control. The results shown are representative of three experiments.
Figure 4
Figure 4. Hypercapnic acidosis activation of GPR4 increases the expression of inflammatory genes in HUVEC.
HUVECs transduced with the control vector (Vector, white bars), or GPR4 expression construct (GPR4, dark bars) were treated for 5 h with EGM-2 media buffered with ambient air, 5% CO2 or 20% CO2. Real-time RT-PCR quantification of mRNA levels of CXCL2 (A), CCL20 (B), IL8 (C), IL1A (D), PTGS2 (E), and CD69 (F) was performed. Ct values were normalized to the housekeeping gene GAPDH. The expression level of the target genes in HUVEC/Vector or HUVEC/GPR4 cells treated with ambient air-buffered EGM-2 medium was set as 1. Error bars indicate the mean ± SEM. *, P<0.05; **, P<0.01; ***, P<0.001; ns, not significant (P>0.05); compared with the ‘ambient air’ groups. The results shown are the average of two biological repeats.
Figure 5
Figure 5. Isocapnic acidosis activation of GPR4 also increases the expression of inflammatory genes in HPAEC and HMVEC-L.
HPAEC or HMVEC-L cells were transduced with the control vector or the GPR4 expression construct (designated as HPAEC/Vector (•), HPAEC/GPR4 (▪), HMVEC-L/Vector (▴), and HMVEC-L/GPR4 (▾)). HPAEC or HMVEC-L cells were then treated with EGM-2/HEM or EGM-2-MV/HEM media at pH 8.4, 7.4, or 6.4 for 5 h, respectively. Real-time RT-PCR quantification of mRNA levels of VCAM1 (A), SELE (B), ICAM1 (C), IL8 (D), CXCL2 (E) and CCL20 (F) was performed. The expression level of the target genes in above-mentioned cells at pH 8.4 was set as 1. Error bars indicate the mean ± SEM. *, P<0.05; **, P<0.01; ***, P<0.001; comparing pH 6.4 to pH 8.4 in HPAEC cells. #, P<0.05; ##, P<0.01; ###, P<0.001; comparing pH 6.4 to pH 8.4 in HMVEC-L cells. The results shown are the average of at least two biological repeats.
Figure 6
Figure 6. NF-κB pathway is involved in acidosis/GPR4-induced inflammatory response.
(A) Western blot of phosphorylated IkB-α expression in HUVEC/Vector and HUVEC/GPR4 cells. Cells were pretreated with EGM-2/HEM pH 8.4 medium for 4 h, followed by the treatment with EGM-2/HEM media at pH 8.4, 7.4, or 6.4 for 3 min. The target bands are indicated by an arrow. Western blot of GAPDH serves as a loading control. (B–E) HUVEC/Vector or HUVEC/GPR4 cells were treated for 5 h with EGM-2/HEM pH 8.4, 7.4 or 6.4 media, or with pH 6.4 media containing indicated concentrations of NF-κB inhibitor BAY 11-7082. Total RNA was isolated and cDNA was synthesized. Real-time RT-PCR quantification of gene expression of VCAM1 (B), SELE (C), IL8 (D) and CXCL2 (E) was performed. Ct values were normalized to the housekeeping gene GAPDH. The expression level of the target genes at pH 8.4 was set as 1. Error bars indicate the mean ± SEM. *, P<0.05; **, P<0.01; ***, P<0.001; compared with the pH 6.4 vehicle control in HUVEC/Vector cells. #, P<0.05; ##, P<0.01; ###, P<0.001; compared with the pH 6.4 vehicle control in HUVEC/GPR4 cells. The results shown are the average of at least three biological repeats.
Figure 7
Figure 7. Increased binding of U937 monocytes to vascular endothelial cells treated with acidic pH.
(A) U937 monocytic cells were adherent to acidic pH-treated HUVEC/GPR4 cells under a flow condition. Representative pictures are shown with the adhered U937 cells indicated by arrows. (B) HUVECs stably overexpressing GPR4 or control vector were grown to a monolayer, and were treated with EGM-2/HEM pH 8.4, 7.4 or 6.4 media for 5 h. U937 monocytes were adhered to the pH-treated HUVEC monolayer under a flow condition (0.5 dyne/cm2). Error bars indicate the mean ± SEM. ***, P<0.001; compared with the pH 8.4 groups. The results represent the average of cell counts from 6 fields.
Figure 8
Figure 8. Inhibition of acidosis/GPR4-induced cAMP production by the GPR4 antagonist in HUVEC.
(A–B) HUVEC/Vector and HUVEC/GPR4 cells were treated with varying pH in the presence or absence of the GPR4 antagonist EIDIP. After the pH treatment, intracellular cAMP was measured as described in the Materials and Methods. The vehicle control had 0.04% DMSO which is the same DMSO concentration as that in 20 µM GPR4 antagonist. The results are the average of 10 samples for HUVEC/Vector cells and 7 samples for HUVEC/GPR4 cells. Error bars indicate the mean ± SEM. **, P<0.01; ***, P<0.001; ns, not significant.
Figure 9
Figure 9. Inhibition of GPR4 activation by its antagonist attenuates the expression of inflammatory genes.
(A–E) HUVEC/Vector or HUVEC/GPR4 cells were treated for 5 h with EGM-2/HEM pH 8.4, 7.4 or 6.4 media, or with pH 6.4 media containing indicated concentrations of GPR4 antagonist. Total RNA was isolated and cDNA was synthesized. Real-time RT-PCR quantification of gene expression of VCAM1 (A), SELE (B), ICAM1 (C), IL8 (D) and CXCL2 (E) was performed. The expression level of the target gene in HUVECs at pH 8.4 was set as 1. Error bars indicate the mean ± SEM. *, P<0.05; **, P<0.01; ***, P<0.001; compared with the pH 6.4 vehicle control in HUVEC/Vector cells. #, P<0.05; ##, P<0.01; ###, P<0.001; compared with the pH 6.4 vehicle control in HUVEC/GPR4 cells. The results shown are the average of at least two biological repeats. (F) HUVECs stably overexpressing GPR4 were grown to form a monolayer. Cells were then pretreated with vehicle or GPR4 antagonist (at indicated concentrations) for 1 h, followed by the treatment with indicated pH media or pH 6.4 medium containing indicated concentrations of GPR4 antagonist for 5 h. The static cell adhesion assay was then performed using U937 monocyte binding as a functional readout as previously described . Error bars indicate the mean ± SEM. *, P<0.05; **, P<0.01; compared with the pH 6.4 vehicle group. The results represent the average of cell counts from 3 fields under an inverted microscope (total 100× magnification).

References

    1. Colotta F, Allavena P, Sica A, Garlanda C, Mantovani A (2009) Cancer-related inflammation, the seventh hallmark of cancer: links to genetic instability. Carcinogenesis 30: 1073–1081. - PubMed
    1. Muller WA (2003) Leukocyte-endothelial-cell interactions in leukocyte transmigration and the inflammatory response. Trends Immunol 24: 327–334. - PubMed
    1. Okpala I (2006) Leukocyte adhesion and the pathophysiology of sickle cell disease. Curr Opin Hematol 13: 40–44. - PubMed
    1. Sughrue ME, Mehra A, Connolly ES Jr, D'Ambrosio AL (2004) Anti-adhesion molecule strategies as potential neuroprotective agents in cerebral ischemia: a critical review of the literature. Inflamm Res 53: 497–508. - PubMed
    1. Castellone RD, Leffler NR, Dong L, Yang LV (2011) Inhibition of tumor cell migration and metastasis by the proton-sensing GPR4 receptor. Cancer Lett. - PubMed

Publication types

MeSH terms

Substances