

Hal2p functions in Bdf1p-involved salt stress response in Saccharomyces cerevisiae
- PMID: 23614021
- PMCID: PMC3629146
- DOI: 10.1371/journal.pone.0062110
Hal2p functions in Bdf1p-involved salt stress response in Saccharomyces cerevisiae
Abstract
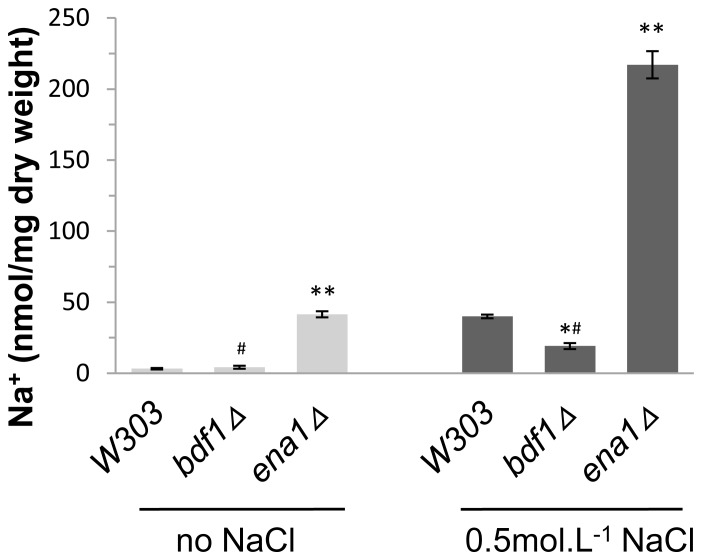
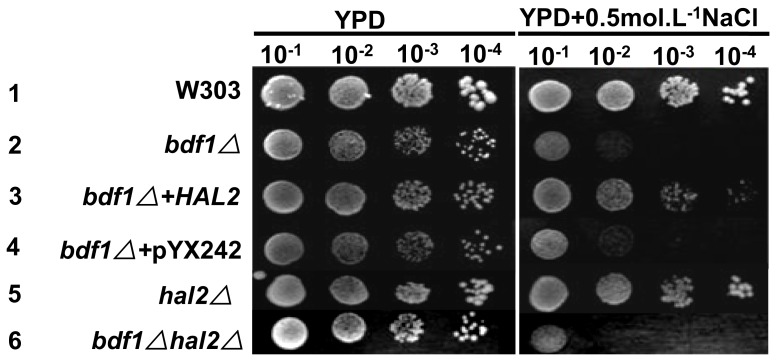
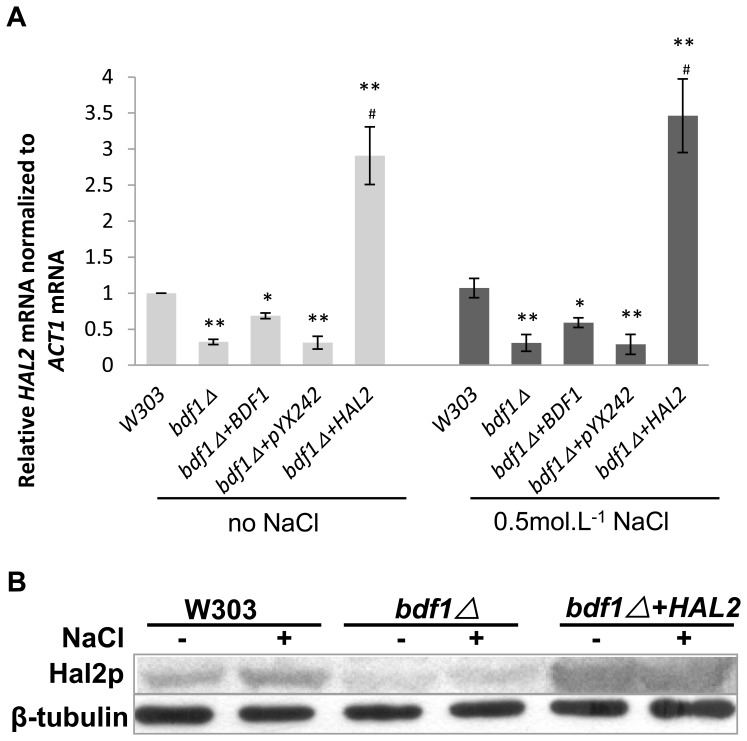
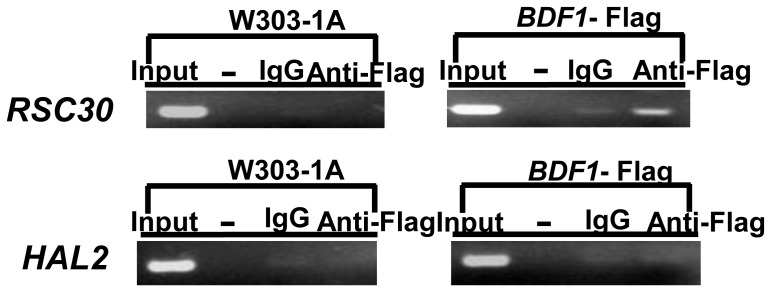
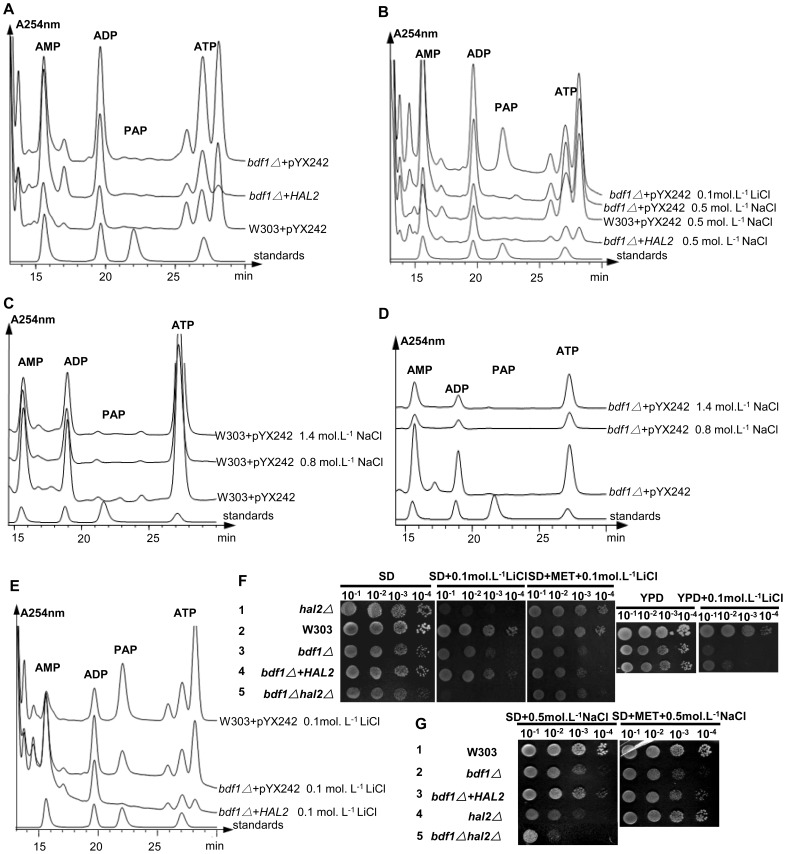
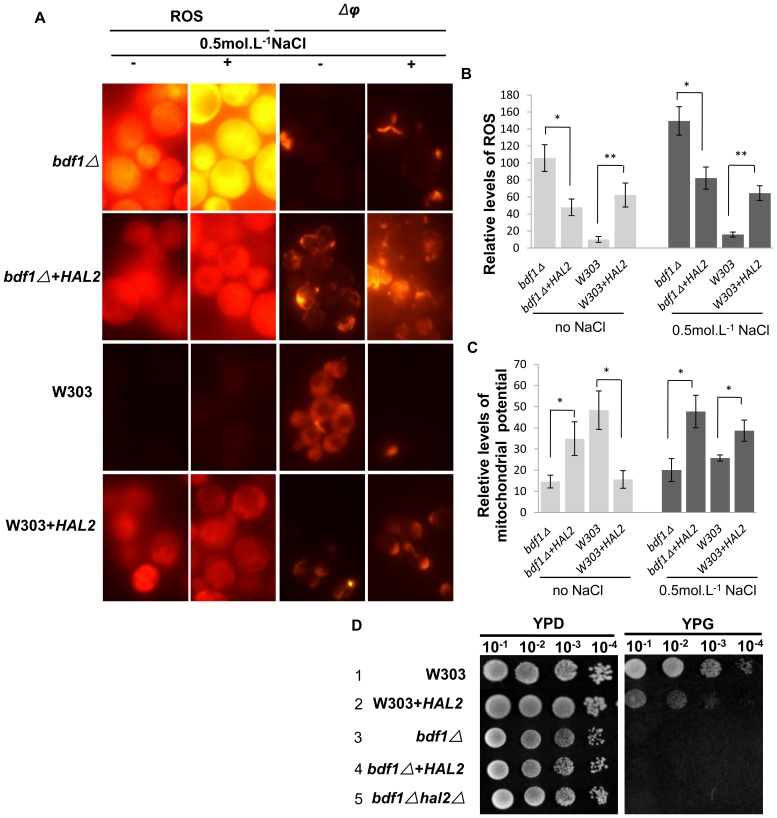
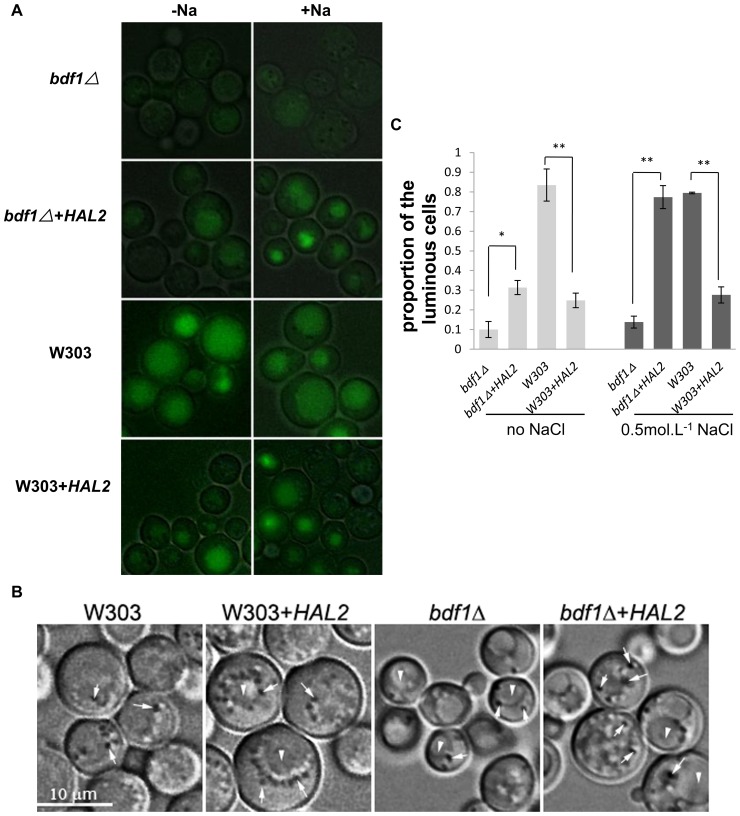
The Saccharomyces cerevisiae Bdf1p associates with the basal transcription complexes TFIID and acts as a transcriptional regulator. Lack of Bdf1p is salt sensitive and displays abnormal mitochondrial function. The nucleotidase Hal2p detoxifies the toxic compound 3' -phosphoadenosine-5'-phosphate (pAp), which blocks the biosynthesis of methionine. Hal2p is also a target of high concentration of Na(+). Here, we reported that HAL2 overexpression recovered the salt stress sensitivity of bdf1Δ. Further evidence demonstrated that HAL2 expression was regulated indirectly by Bdf1p. The salt stress response mechanisms mediated by Bdf1p and Hal2p were different. Unlike hal2Δ, high Na(+) or Li(+) stress did not cause pAp accumulation in bdf1Δ and methionine supplementation did not recover its salt sensitivity. HAL2 overexpression in bdf1Δ reduced ROS level and improved mitochondrial function, but not respiration. Further analyses suggested that autophagy was apparently defective in bdf1Δ, and autophagy stimulated by Hal2p may play an important role in recovering mitochondrial functions and Na(+) sensitivity of bdf1Δ. Our findings shed new light towards our understanding about the molecular mechanism of Bdf1p-involved salt stress response in budding yeast.
Conflict of interest statement
Figures
Similar articles
-
HAL2 overexpression induces iron acquisition in bdf1Δ cells and enhances their salt resistance.Curr Genet. 2017 May;63(2):229-239. doi: 10.1007/s00294-016-0628-9. Epub 2016 Jul 8. Curr Genet. 2017. PMID: 27387517
-
Regulation of Saccharomyces cerevisiae MEF1 by Hda1p affects salt resistance of bdf1Δ mutant.FEMS Yeast Res. 2014 Jun;14(4):575-85. doi: 10.1111/1567-1364.12144. FEMS Yeast Res. 2014. PMID: 25035869
-
Bdf1p deletion affects mitochondrial function and causes apoptotic cell death under salt stress.FEMS Yeast Res. 2009 Mar;9(2):240-6. doi: 10.1111/j.1567-1364.2008.00469.x. FEMS Yeast Res. 2009. PMID: 19220868
-
Salt tolerance in plants and microorganisms: toxicity targets and defense responses.Int Rev Cytol. 1996;165:1-52. doi: 10.1016/s0074-7696(08)62219-6. Int Rev Cytol. 1996. PMID: 8900956 Review.
-
Reactive oxygen species and yeast apoptosis.Biochim Biophys Acta. 2008 Jul;1783(7):1354-68. doi: 10.1016/j.bbamcr.2008.01.023. Epub 2008 Feb 11. Biochim Biophys Acta. 2008. PMID: 18298957 Review.
Cited by
-
XC_0531 encodes a c-type cytochrome biogenesis protein and is required for pathogenesis in Xanthomonas campestris pv. campestris.BMC Microbiol. 2017 Jun 27;17(1):142. doi: 10.1186/s12866-017-1056-9. BMC Microbiol. 2017. PMID: 28655353 Free PMC article.
-
HAL2 overexpression induces iron acquisition in bdf1Δ cells and enhances their salt resistance.Curr Genet. 2017 May;63(2):229-239. doi: 10.1007/s00294-016-0628-9. Epub 2016 Jul 8. Curr Genet. 2017. PMID: 27387517
-
Stress-induced nuclear RNA degradation pathways regulate yeast bromodomain factor 2 to promote cell survival.PLoS Genet. 2014 Sep 18;10(9):e1004661. doi: 10.1371/journal.pgen.1004661. eCollection 2014 Sep. PLoS Genet. 2014. PMID: 25232960 Free PMC article.
-
Data set for cloning and characterization of heterologous transporters in Saccharomyces cerevisiae and identification of important amino acids for xylose utilization.Data Brief. 2015 May 19;4:119-26. doi: 10.1016/j.dib.2015.05.005. eCollection 2015 Sep. Data Brief. 2015. PMID: 26217774 Free PMC article.
References
-
- Rodríguez-Navarro A, Quintero FJ, Garciadeblas B (1994) Na+-ATPases and Na+/H+ antiporters in fungi. Biochim Biophys Acta 1187: 203–205. - PubMed
-
- Hirata D, Harada S, Namba H, Miyakawa T (1995) Adaptation to high-salt stress in Saccharomyces cerevisiae is regulated by Ca2+/calmodulin-dependent phosphoprotein phosphatase (calcineurin) and cAMP-dependent protein kinase. Mol Gen Genet 249: 257–264. - PubMed
-
- Serrano R, Gaxiola R (1994) Microbial models and salt stress tolerance in plants. CRC Crit Rev Plant Sci 13: 121–138.
-
- Serrano R, Mulet JM, Rios G, Marquez JA, de Larrinoa IF, et al. (1999) A glimpse of the mechanisms of ion homeostasis during salt stress. J Exp Bot 50: 1023–1036.
Publication types
MeSH terms
Substances
LinkOut - more resources
Full Text Sources
Other Literature Sources
Molecular Biology Databases
Research Materials
