

The stranding anomaly as population indicator: the case of harbour porpoise Phocoena phocoena in North-Western Europe
- PMID: 23614031
- PMCID: PMC3632559
- DOI: 10.1371/journal.pone.0062180
The stranding anomaly as population indicator: the case of harbour porpoise Phocoena phocoena in North-Western Europe
Erratum in
- PLoS One. 2014;9(1). doi:10.1371/annotation/1ce2f54e-1eea-4dba-8742-05db1017b44f
Abstract
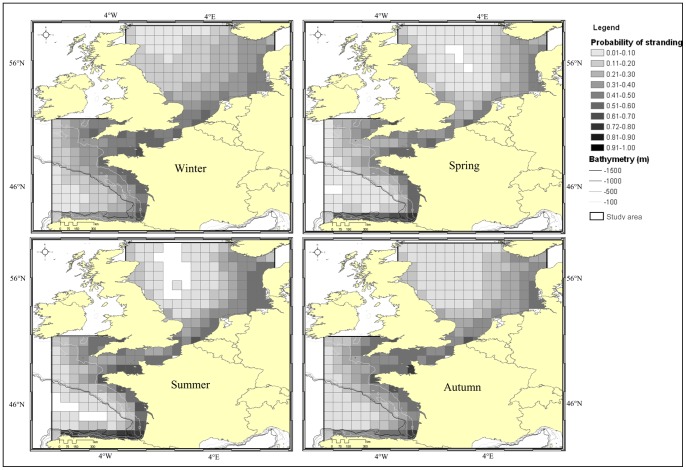
Ecological indicators for monitoring strategies are expected to combine three major characteristics: ecological significance, statistical credibility, and cost-effectiveness. Strategies based on stranding networks rank highly in cost-effectiveness, but their ecological significance and statistical credibility are disputed. Our present goal is to improve the value of stranding data as population indicator as part of monitoring strategies by constructing the spatial and temporal null hypothesis for strandings. The null hypothesis is defined as: small cetacean distribution and mortality are uniform in space and constant in time. We used a drift model to map stranding probabilities and predict stranding patterns of cetacean carcasses under H0 across the North Sea, the Channel and the Bay of Biscay, for the period 1990-2009. As the most common cetacean occurring in this area, we chose the harbour porpoise Phocoena phocoena for our modelling. The difference between these strandings expected under H0 and observed strandings is defined as the stranding anomaly. It constituted the stranding data series corrected for drift conditions. Seasonal decomposition of stranding anomaly suggested that drift conditions did not explain observed seasonal variations of porpoise strandings. Long-term stranding anomalies increased first in the southern North Sea, the Channel and Bay of Biscay coasts, and finally the eastern North Sea. The hypothesis of changes in porpoise distribution was consistent with local visual surveys, mostly SCANS surveys (1994 and 2005). This new indicator could be applied to cetacean populations across the world and more widely to marine megafauna.
Conflict of interest statement
Figures


References
-
- Asseburg C, Harwood J, Matthiopoulos J, Smout S (2006) The functional response of generalist predators and its implications for the monitoring of marine ecosystems. In: Camphusen CJ, Boyd IL, Wanless S, editors. Top Predators in Marine Ecosystems: Their Role in Monitoring and Management (Conservation Biology). New York: Cambridge University Press. 262–274.
-
- Sergio F, Newton I, Marchesi L, Pedrini P (2006) Ecologically justified charisma: preservation of top predators delivers biodiversity conservation. Journal of Applied Ecology 43: 1049–1055.
-
- Sergio F, Caro T, Brown D, Clucas B, Hunter J, et al. (2008) Top predators as conservation tools: ecological rationale, assumptions, and efficacy. Annu Rev Ecol Evol Syst 39: 1–19.
-
- Mace GM, Baillie JEM (2007) The 2010 Biodiversity Indicators: Challenges for Science and Policy. Conservation Biology 21: 1406–1413. - PubMed
-
- Boyd IL, Wanless S, Camphuysen J (2006) Introduction. In: Camphusen CJ, Boyd IL, Wanless S, editors. Top Predators in Marine Ecosystems: Their Role in Monitoring and Management (Conservation Biology). New York: Cambridge University Press. 1–11.
Publication types
MeSH terms
LinkOut - more resources
Full Text Sources
Other Literature Sources
Medical
Research Materials
