. 2013 Jul;50(7):595-609.
doi: 10.1111/psyp.12045. Epub 2013 Apr 25.

Association between P3 event-related potential amplitude and externalizing disorders: a time-domain and time-frequency investigation of 29-year-old adults

Affiliations

Association between P3 event-related potential amplitude and externalizing disorders: a time-domain and time-frequency investigation of 29-year-old adults

Henry H Yoon et al. Psychophysiology. 2013 Jul.

Abstract

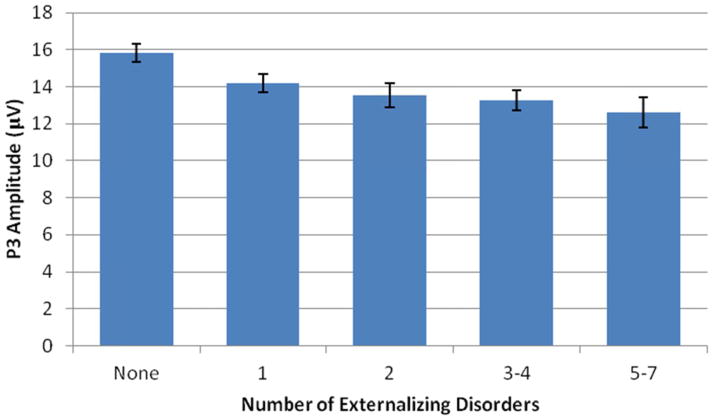
This study determined whether time-domain P3 amplitude and time-frequency principal component (TF-PC) reductions are present in adulthood (age 29) when participants have largely passed through the age of heaviest substance misuse. Participants were assessed from age 17 through 29 for lifetime externalizing (EXT) disorders. EEG comparisons from three topographic regions were examined for P3 amplitude and TF-PCs at delta and theta frequency ranges. Significant P3 amplitude reductions were found in those with EXT for both regional and site-Pz analyses, with stronger effects observed the greater the EXT comorbidity. Reductions were also observed in all eight TF-PCs extracted, with a delta component yielding frontal effects not apparent in the time domain. Overall, results suggest that these brain measures continue, at age 29, to provide effective indices of EXT that potentially tap a neural substrate related to behavioral disinhibition.


Figures

Figure 1
Figure 1. Topographic regions derived from principal components analysis (PCA)
Three topographic regions were identified by PCA using P3 peak amplitude scores from each of the 61 electrode sites, followed by Varimax rotation. Each electrode was then assigned to a spatial component based on its highest loading. For group comparisons, mean activity of all electrodes within each region constituted our measure of P3 amplitude for that region. These P3 amplitude-defined regions were then used to determine corresponding P3 latency and TF component values.
Figure 2
Figure 2. Degree to which time-domain P3 amplitude is reduced for those with any externalizing disorder
Effect sizes corresponding to each of the three topographic regions from the comparisons between the composite Any-EXT group versus healthy controls are displayed. Effect sizes were obtained by converting the mean microvolt (μV) difference between controls and the Any-EXT group for each of the three regions examined in the MANOVAs into statistics analogous to Cohen’s d, using a standard formula for converting t-statistics to d (Rosenthal, 1991). Any-EXT refers to any participant meeting lifetime diagnosis for an externalizing disorder by age-29.
Figure 3
Figure 3
Figure 3 (A–D). Grand average waveforms for time-domain P3 coinciding with activity at the three topographic regions and site-Pz for the composite Any-EXT group and healthy controls. Presented schematically are the frontal (Figure 3A), central-parietal (Figure 3B), and parietal-occipital (Figure 3C) topographic regions identified by PCA as well as activity at site-Pz (Figure 3D). The grand average waveform activity associated with the target trials for the Any-EXT (i.e., any participant meeting lifetime diagnosis for an EXT disorder by age-29) and control groups are also displayed corresponding to these topographic sites.
Figure 4
Figure 4. Grand average waveforms and time-frequency component alignment from the 61-channel and site-Pz decompositions
Grand-averaged time-domain and time-frequency (Avg) plots corresponding to the 61-channel (left panel) and site-Pz (right panel) are presented at the top. The eight time-frequency components (PCs 1–8) retained from the principal components analysis decomposition are presented below the grand averages. For all time-frequency plots, x-axis is time from stimulus onset (0 ms) to 1000 ms, and y-axes range from 0 – 5.75 Hz. Time-frequency components on the left panel corresponding to the 61-channel decompositions are numbered (PCs 1–8: highest to lowest) based on the amount of variance for which they account in the varimax-rotated solution. Analogous TF-PCs derived from site-Pz (right panel) were aligned to the components from the 61-channel solution based on patterns of TF-PC peak correlations and cross-factor loadings. Congruence coefficients (CC) associated with the TF-PC pairings are also indicated.
Figure 5
Figure 5. Degree to which time-frequency components are reduced for those with any externalizing disorder
Effect sizes corresponding to each of the three topographic regions from the comparisons between the composite Any-EXT group versus controls for each of the eight TF-PCs depicted in Fig. 4 and described in Table 2. Effect sizes were obtained by converting the mean weighted energy unit differences between controls and the Any-EXT group for each of the three regions examined in the MANOVAs into statistics analogous to Cohen’s d, using a standard formula for converting t-statistics to d (Rosenthal, 1991). Any-EXT refers to any participant meeting lifetime diagnosis for an externalizing disorder by age-29.
Figure 6
Figure 6. Profile plot for time-domain P3 peak amplitude
Time-domain profile plots coinciding with the Any-EXT and control groups are displayed to illustrate the nature of the significant Group x Region interactions for P3 amplitude comparisons. This pattern was generally observed for the Any-EXT analyses in the time-frequency domain, i.e., non-significant frontal discriminations but significant effects at the two posterior regions (i.e., central-parietal, parietal-occipital).
Figure 7
Figure 7. Reduction in P3 amplitude in relation to the number of externalizing disorders
Mean amplitude of the P3 at site-Pz, with error bars representing 1 SE, is given for groups defined on the basis of the number of EXT diagnoses. The pattern indicates that greater comorbidity of lifetime EXT disorders is associated with greater reduction in P3 amplitude. Because the number of subjects with a given number of diagnoses declines with the number of diagnoses, we created groups of relatively comparable size by collapsing some categories.

References

    1. American Psychiatric Association. Diagnostic and statistical manual of mental disorders. 3. Washington, D.C: Author; 1987. rev.
    1. American Psychiatric Association. Diagnostic and statistical manual of mental disorders. 4. Washington, DC: Author; 1994.
    1. Anokhin AP, Vedeniapin AB, Sirevaag EJ, Bauer LO, O’Connor SJ, Kuperman S, Rohrbaugh JW. The P300 brain potential is reduced in smokers. Psychopharmacology. 2000;149:409–413. - PubMed
    1. Barry RJ, Johnstone SJ, Clarke AR. A review of electrophysiology in attention-deficit/hyperactivity disorder: II. Event-related potentials. Clinical Neurophysiology. 2003;114:184–198. - PubMed
    1. Basar-Eroglu C, Basar E, Demiralp T, Schurmann M. P300-response: possible psychophysiological correlates in delta and theta frequency channels. A review. International Journal of Psychophysiology. 1992;13:161–179. - PubMed

Publication types

MeSH terms