. 2013 May 21;52(20):3464-77.
doi: 10.1021/bi400322e. Epub 2013 May 7.

Side-chain conformational heterogeneity of intermediates in the Escherichia coli dihydrofolate reductase catalytic cycle

Affiliations

Side-chain conformational heterogeneity of intermediates in the Escherichia coli dihydrofolate reductase catalytic cycle

Lisa M Tuttle et al. Biochemistry. .

Abstract

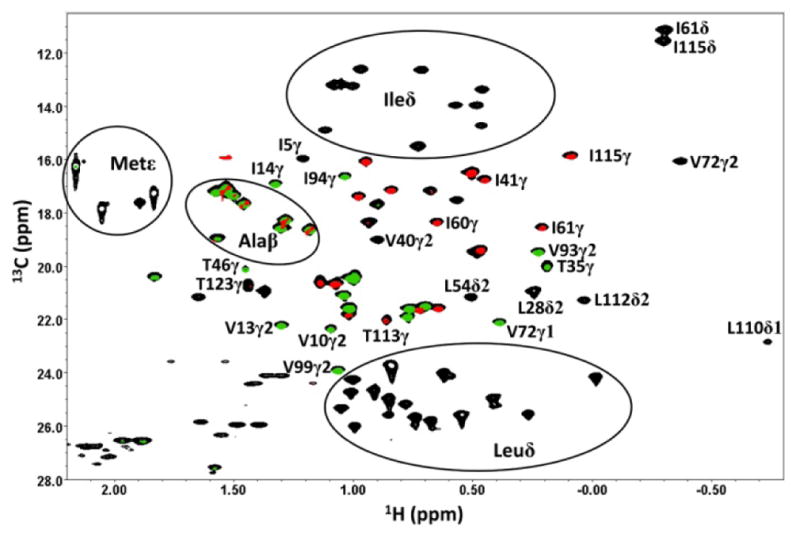
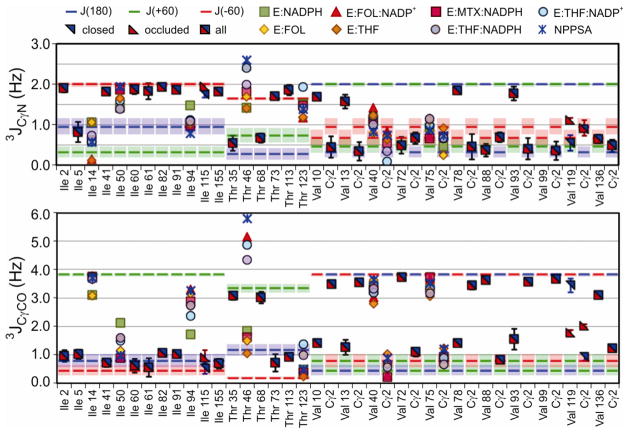
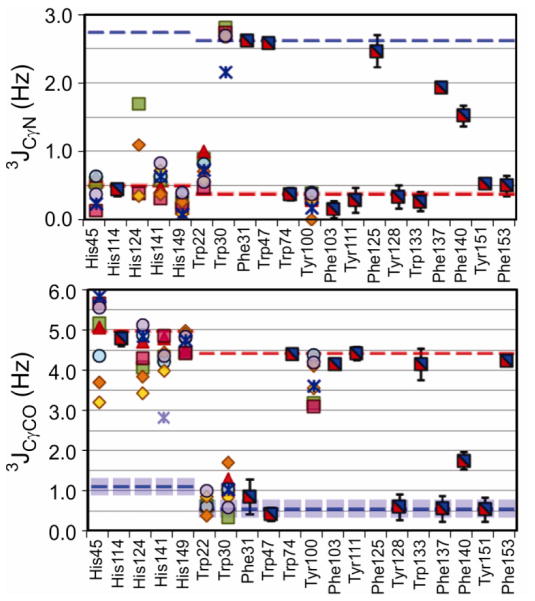
Escherichia coli dihydrofolate reductase (DHFR) provides a paradigm for the integrated study of the role of protein dynamics in enzyme function. Previous studies of backbone and side chain dynamics have yielded unprecedented insights into the mechanism by which DHFR progresses through the structural changes that occur during its catalytic cycle. Here we report a comprehensive study of the χ1 rotamer populations of the aromatic and γ-methyl containing residues for complexes of the catalytic cycle, based on NMR measurement of (3)JCγCO and (3)JCγN coupling constants. We report conformational and dynamic information for eight distinct complexes, where transitions between rotamer wells may occur on a broad picosecond to millisecond time scale. This large volume of (3)J data has allowed us to fit new Karplus parameterizations for aromatic side chains and to select the best available of previously determined parameters for Ile, Thr, and Val. The (3)JCγCO and (3)JCγN coupling constants are found to be extremely sensitive measures of side chain χ1 rotamers and to give important insights into the extent of conformational averaging. For a subset of residues in DHFR, the extent of rotamer averaging is invariant to the nature of the bound ligand, while for other residues the rotamer averaging differs in one or more complexes of the enzymatic cycle. These variable-averaging residues are generally located near the active site, but the phenomenon extends into the adenosine binding domain. For several residues, the rotamer populations in different DHFR complexes appear to depend on whether the complex is in the closed or occluded state, and some residues are exquisitely sensitive to small changes in the nature of the bound ligand.


Conflict of interest statement

The authors declare no competing financial interest.

Figures

Figure 1
Figure 1
A. Structure of E. coli DHFR: adenosine binding domain is shown in pink. Two different structures are superimposed, E:FOL:NADP+ (1RX2), with the Met20 loop in the closed configuration (shown in blue) and E:THF:NADP+ (1RX4) with the Met20 loop in the occluded configuration (shown in red). The F–G loop is shown in green, and the G–H loop in purple. Folate (from 1RX2) is shown in yellow; NADP+ is in blue for the closed state and red for the occluded state, with the nicotinamide ring in a position out of the active site pocket. B. Enzymatic cycle for DHFR, colored according to the superimposed structures in part A. Top row shows the closed complexes; bottom row, occluded. In addition to the intermediates of the catalytic cycle and analogues, 3J measurements also were obtained for the closed N23PP/S148A E:FOL:NADP+ complex. C. Schematic showing each of the χ1 rotamers (here for isoleucine), with the measured couplings indicated; rotamer populations are calculated based on the measured 3JCγCO and 3JCγN values using Eqs 1–3.
Figure 2
Figure 2
Portion of the 13C HSQC spectrum of N23PP/S148A E:FOL:NADP+ (black), overlaid with the corresponding portions of the CγCO (green) and CγN (red) difference spectra. Only the CγH3 cross peaks for Ile, Thr, and Val give information in these spectra, although the CβH3 cross peaks of Ala have detectable intensity in the difference spectra. The relative contour levels are 1:0.5:0.25 for the reference, 3JCγCO difference, and 3JCγN difference spectra, respectively.
Figure 3
Figure 3
Karplus correlations (plots of χ1 angle against 3J) for aromatic residues. The χ1 angle values are taken from the x-ray crystal structures of E:NADPH (1RX1), E:FOL:NADP+ (3QL3), E:MTX:NADPH (1RX3), E:THF:NADP/H (1RX4), E:THF (1RX5), E:FOL (1RX7), and N23PP/S148A E:FOL:NADP+ (3QL0)., The 3J values were selected from the data measured in this work for the same complexes in solution. All measured data are plotted. For the least-squares fit to the Karplus equation (J = A cos2 (θ + δ) + B cos (θ + δ) + C), only 3J values for residues without significant rotamer averaging were used. These are indicated by filled circles. Empty circles indicate data with exceptionally large errors or with 3J couplings that are suggestive of rotamer averaging; these data were excluded from the re-parameterization fits. The black curves in each panel are derived from published Karplus parameters., The red curves are derived from the Karplus parameters calculated for the non-averaging aromatic residues in DHFR. Vertical red lines represent the error bars (standard deviations between multiple measurements) for the experimental 3J values.
Figure 4
Figure 4
Measured Ile, Thr, and Val methyl 3JCγCO and 3JCγN values for the 8 complexes of DHFR, represented by the colored symbols shown. When the values for all complexes have overlapping error ranges, the value is represented by a square halved red and blue, with error bars representing the standard deviation of the values if appropriate. If all occluded or closed complexes have overlapping error ranges, that value is represented by a red or blue triangle respectively. Error bars for individual complexes are left off for clarity (see SI for complete tables with error). NPPSA refers to the N23PP/S148A E:FOL:NADP+ complex. The expectation values Jt, Jg, and Jh (J180, J+60, J−60) for each residue, derived using the new Karplus parameters, are shown as blue, green, and red bars, respectively, with shaded areas showing a ±5° variation about these values. The following residues are excluded from the ‘All’ complex 3J averages due to resonance broadening and/or overlap: Ile5, E:THF:NADP/H; Val13 Cγ1, closed complexes; Trp47, E:FOL:NADP+; Val88 Cγ1, E:NADPH and E:THF:NADPH; Val99 Cγ1, all complexes; Thr113, THF containing complexes. Thr46 couplings that are aberrantly large in the presence of NADP/H are not interpreted in terms of Eqs 1–3.
Figure 5
Figure 5
Measured Phe, Trp, Tyr, and His 3JCγCO and 3JCγN values for the 8 complexes of DHFR, represented by the colored symbols, groups and expectation values shown at the top of Figure 4. The NPPSA 3JCγN value for His141 is a lower bound, due to resonance overlap.
Figure 6
Figure 6
A. 3JCγCO (red) and 3JCγN (blue) Karplus curves for Phe, Trp, and Tyr residues (FWY), determined from fits of DHFR 3J data. Shaded regions span ±5° about the staggered rotamer angles; this variation in 3J is plotted as shaded bars around the Jt, Jg, and Jh values in Figures 4 and 5. B. Effect of local dynamics on Karplus correlations, according to Eq. 6. Dotted curves illustrate a hypothetical Karplus correlation for fixed side chains. Solid and dashed curves show the effect of Gaussian rotamer sampling with (respectively) 15° and 30° standard deviation relative to the fixed Karplus curve.
Figure 7
Figure 7
Primary χ1 rotamer angle for the aromatic, Ile, Thr, and Val residues from A. the x-ray structures (PDB codes shown) and B. the major rotamer based on 3J couplings.
Figure 8
Figure 8
Primary χ2 rotamer angle for Leu residues. A. from the x-ray structures (PDB codes shown in Figure 7). B. the chemical shift based population of the 180° rotamer.
Figure 9
Figure 9
Extent of rotamer averaging plotted on the E:FOL:NADP+ structure (3QL3). Going clockwise, each quadrant shows a 90° rotation about the vertical axis in the plane of the page. FOL is shown as yellow sticks; NADP+ is orange sticks. Spheres representing side chain heavy atoms are shown for all aromatic, Ile, Thr, and Val residues. Residues with statistically significant variations in rotamer averaging, with uncertainties in 3J values taken into account, in one or more DHFR complexes are colored green (with green residue labels). Residues that show similar rotamer averaging for each of the DHFR complexes studied are labeled in red and colored white to red to indicate the extent of averaging, with red coloring denoting the most rotamer averaging. The gradient goes from white (pmajor = 1.0) to red (pmajor = 0.6), where pmajor = max[p180, p−60, p+60] as determined according to Eqs 1–3. In cases where rotamer hopping is not expected (e.g. Trp22 and other aromatics), this pmajor is considered a measure of the extent of local motions within a single rotamer well (see Figure 6B for an illustration of the effect this has on 3J values).
Figure 10
Figure 10
Summary of differences in rotamer averaging between complexes of E. coli DHFR. Differences can arise from changes in the extent of rotamer hopping or from changes in local in-well rotamer motions. The corresponding x-ray structure is shown for each complex [E:NADPH (1RX1), E:FOL:NADP+ (3QL3), E:MTX:NADPH (1RX3), E:THF:NADP/H (1RX4), E:THF (1RX5), E:FOL (1RX7), and N23PP/S148A E:FOL:NADP+ (3QL0),]. Spheres are shown for Ile, Thr, Val, Leu, and aromatic residues. Ligands are shown as sticks with FOL/THF in yellow and NADP/H in orange. A. The difference in pmajor between the given complex and the next complex in the enzymatic cycle is shown for the residues that show variable averaging between complexes (green residues in Figure 9). Side chains with the same rotamer averaging are shown in white, residues with more (less) rotamer averaging than the next complex in the cycle are shown as red (blue), with more red or blue coloring indicating a larger population difference. B. Difference in rotamer averaging between E:MTX:NADPH and E:FOL:NADP+ complexes. C. Difference in rotamer averaging between N23PP/S148A and wild type E:FOL:NADP+ complexes. D. Difference in rotamer averaging between E:FOL and E:THF. A–D Leu62, Ile94, and Val119 have a different major rotamer depending on the complex, so differences in rotamer averaging are given with respect to the 180° χ2, +60o χ1 and −60° χ1 rotamers, respectively. The color gradient in panels A–D runs from Δpmajor = −0.5 (blue) < 0 (white) < 0.5 (red), where Δpmajor is the difference in major rotamer population between the displayed complex and the next complex in the catalytic cycle (A) or the complex indicated in parentheses (B–D).

References

    1. Bystroff C, Oatley SJ, Kraut J. Crystal structures of Escherichia coli dihydrofolate reductase: the NADP+ holoenzyme and the folate. NADP+ ternary complex Substrate binding and a model for the transition state. Biochemistry. 1990;29:3263–3277. - PubMed
    1. Bystroff C, Kraut J. Crystal structure of unliganded Escherichia coli dihydrofolate reductase. Ligand-induced conformational changes and cooperativity in binding. Biochemistry. 1991;30:2227–2239. - PubMed
    1. Sawaya MR, Kraut J. Loop and subdomain movements in the mechanism of Escherichia coli dihydrofolate reductase: crystallographic evidence. Biochemistry. 1997;36:586–603. - PubMed
    1. Schnell JR, Dyson HJ, Wright PE. Structure, dynamics and catalytic function of dihydrofolate reductase. Ann Rev Biophys Biomol Struct. 2004;33:119–140. - PubMed
    1. Boehr DD, McElheny D, Dyson HJ, Wright PE. Millisecond timescale fluctuations in dihydrofolate reductase are exquisitely sensitive to the bound ligands. Proceedings of the National Academy of Sciences. 2010;107:1373–1378. - PMC - PubMed

Publication types

MeSH terms

Substances

LinkOut - more resources