

MAP65/Ase1 promote microtubule flexibility
- PMID: 23615441
- PMCID: PMC3681700
- DOI: 10.1091/mbc.E13-03-0141
MAP65/Ase1 promote microtubule flexibility
Abstract
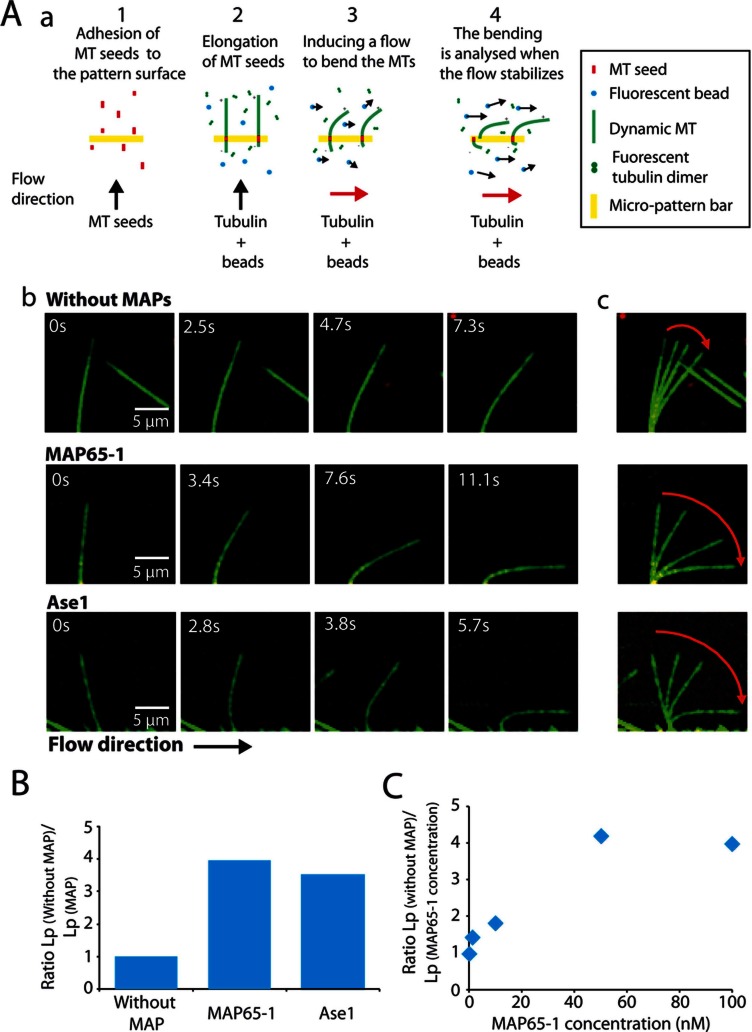
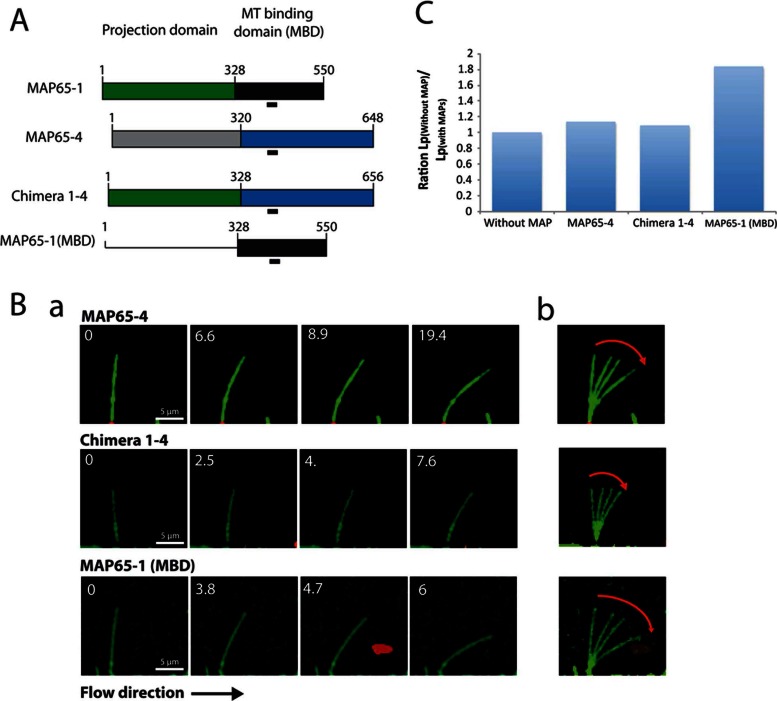
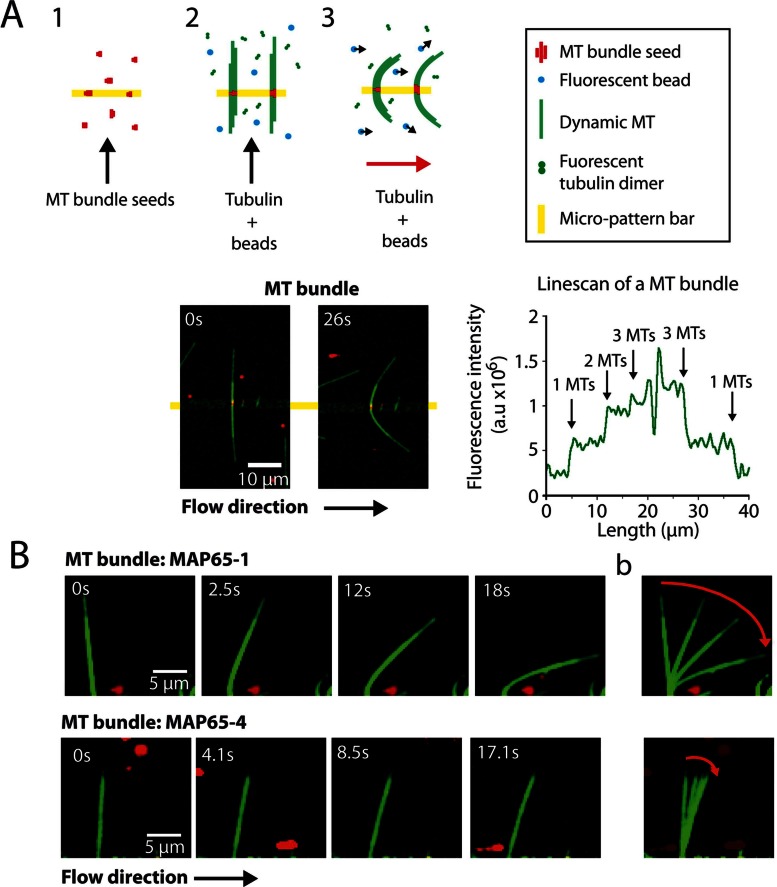
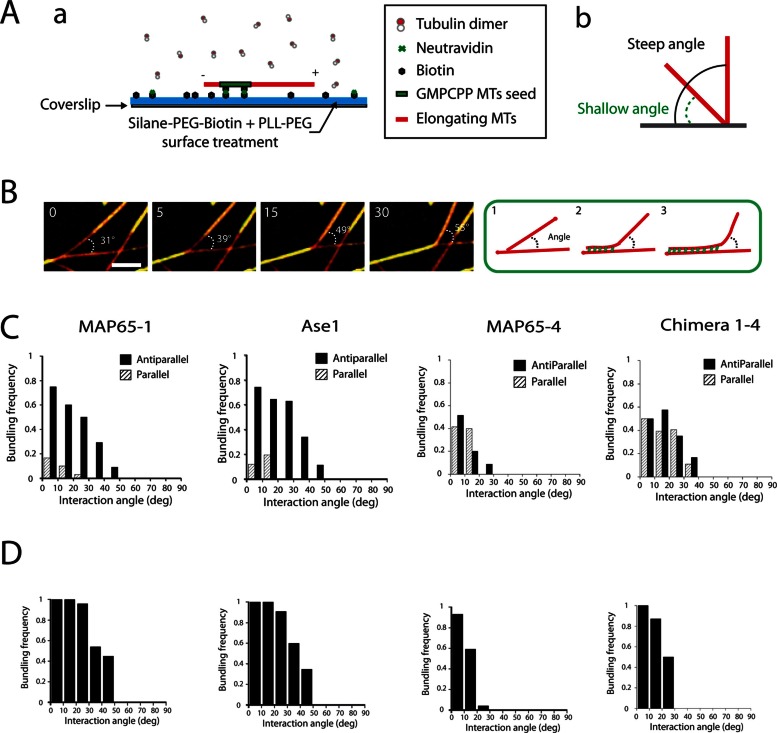
Microtubules (MTs) are dynamic cytoskeletal elements involved in numerous cellular processes. Although they are highly rigid polymers with a persistence length of 1-8 mm, they may exhibit a curved shape at a scale of few micrometers within cells, depending on their biological functions. However, how MT flexural rigidity in cells is regulated remains poorly understood. Here we ask whether MT-associated proteins (MAPs) could locally control the mechanical properties of MTs. We show that two major cross-linkers of the conserved MAP65/PRC1/Ase1 family drastically decrease MT rigidity. Their MT-binding domain mediates this effect. Remarkably, the softening effect of MAP65 observed on single MTs is maintained when MTs are cross-linked. By reconstituting physical collisions between growing MTs/MT bundles, we further show that the decrease in MT stiffness induced by MAP65 proteins is responsible for the sharp bending deformations observed in cells when they coalign at a steep angle to create bundles. Taken together, these data provide new insights into how MAP65, by modifying MT mechanical properties, may regulate the formation of complex MT arrays.
Figures
Similar articles
-
MAP65 coordinate microtubule growth during bundle formation.PLoS One. 2013;8(2):e56808. doi: 10.1371/journal.pone.0056808. Epub 2013 Feb 21. PLoS One. 2013. PMID: 23437247 Free PMC article.
-
Single-molecule analysis of the microtubule cross-linking protein MAP65-1 reveals a molecular mechanism for contact-angle-dependent microtubule bundling.Biophys J. 2012 Feb 22;102(4):802-9. doi: 10.1016/j.bpj.2012.01.008. Epub 2012 Feb 21. Biophys J. 2012. PMID: 22385851 Free PMC article.
-
Arabidopsis kinetochore fiber-associated MAP65-4 cross-links microtubules and promotes microtubule bundle elongation.Plant Cell. 2010 Nov;22(11):3804-15. doi: 10.1105/tpc.110.080606. Epub 2010 Nov 30. Plant Cell. 2010. PMID: 21119057 Free PMC article.
-
Regulation of microtubule dynamics by TOG-domain proteins XMAP215/Dis1 and CLASP.Trends Cell Biol. 2011 Oct;21(10):604-14. doi: 10.1016/j.tcb.2011.06.007. Epub 2011 Jul 23. Trends Cell Biol. 2011. PMID: 21782439 Free PMC article. Review.
-
Microtubule organization and microtubule-associated proteins in plant cells.Int Rev Cell Mol Biol. 2014;312:1-52. doi: 10.1016/B978-0-12-800178-3.00001-4. Int Rev Cell Mol Biol. 2014. PMID: 25262237 Review.
Cited by
-
EB1 contributes to microtubule bundling and organization, along with root growth, in Arabidopsis thaliana.Biol Open. 2018 Aug 2;7(8):bio030510. doi: 10.1242/bio.030510. Biol Open. 2018. PMID: 29945874 Free PMC article.
-
Self-repair promotes microtubule rescue.Nat Cell Biol. 2016 Oct;18(10):1054-1064. doi: 10.1038/ncb3406. Epub 2016 Sep 12. Nat Cell Biol. 2016. PMID: 27617929 Free PMC article.
-
Fifteen compelling open questions in plant cell biology.Plant Cell. 2022 Jan 20;34(1):72-102. doi: 10.1093/plcell/koab225. Plant Cell. 2022. PMID: 34529074 Free PMC article. Review.
-
Comprehensive analyses of microtubule-associated protein MAP65 family genes in Cucurbitaceae and CsaMAP65s expression profiles in cucumber.J Appl Genet. 2023 Sep;64(3):393-408. doi: 10.1007/s13353-023-00761-z. Epub 2023 May 23. J Appl Genet. 2023. PMID: 37219731
-
Microtubules acquire resistance from mechanical breakage through intralumenal acetylation.Science. 2017 Apr 21;356(6335):328-332. doi: 10.1126/science.aai8764. Science. 2017. PMID: 28428427 Free PMC article.
References
-
- Bartolini F, Gundersen GG. Generation of noncentrosomal microtubule arrays. J Cell Sci. 2006;119:4155–4163. - PubMed
Publication types
MeSH terms
Substances
LinkOut - more resources
Full Text Sources
Other Literature Sources
Miscellaneous
