

Effects of Fcj1-Mos1 and mitochondrial division on aggregation of mitochondrial DNA nucleoids and organelle morphology
- PMID: 23615445
- PMCID: PMC3681690
- DOI: 10.1091/mbc.E13-03-0125
Effects of Fcj1-Mos1 and mitochondrial division on aggregation of mitochondrial DNA nucleoids and organelle morphology
Abstract
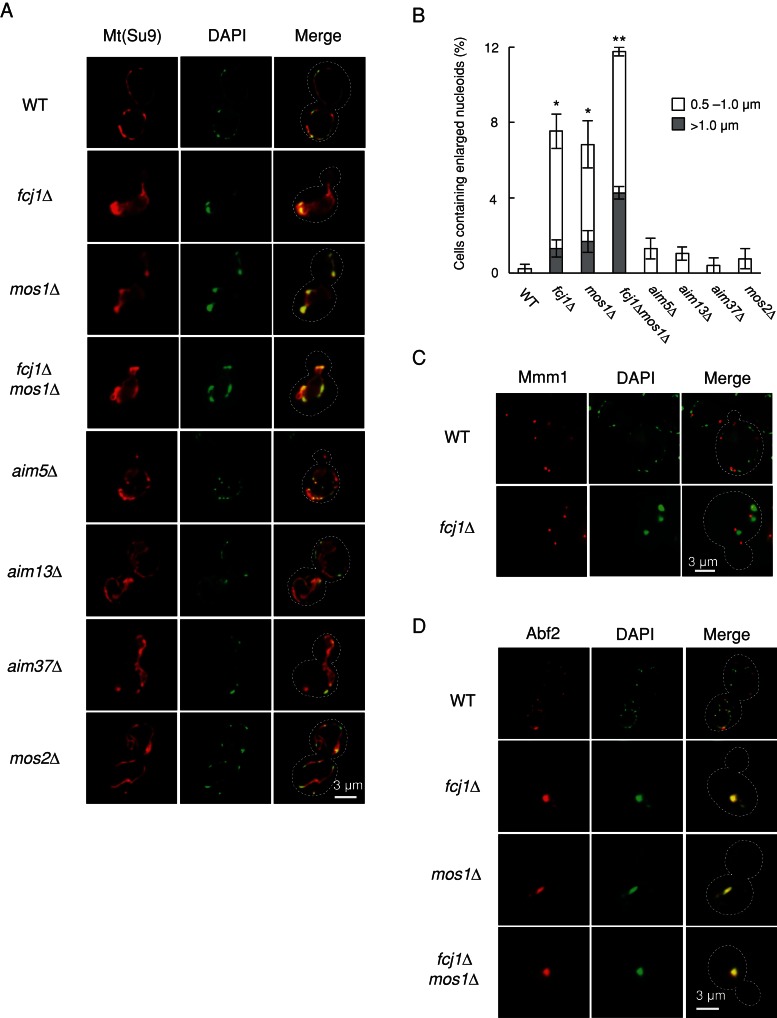
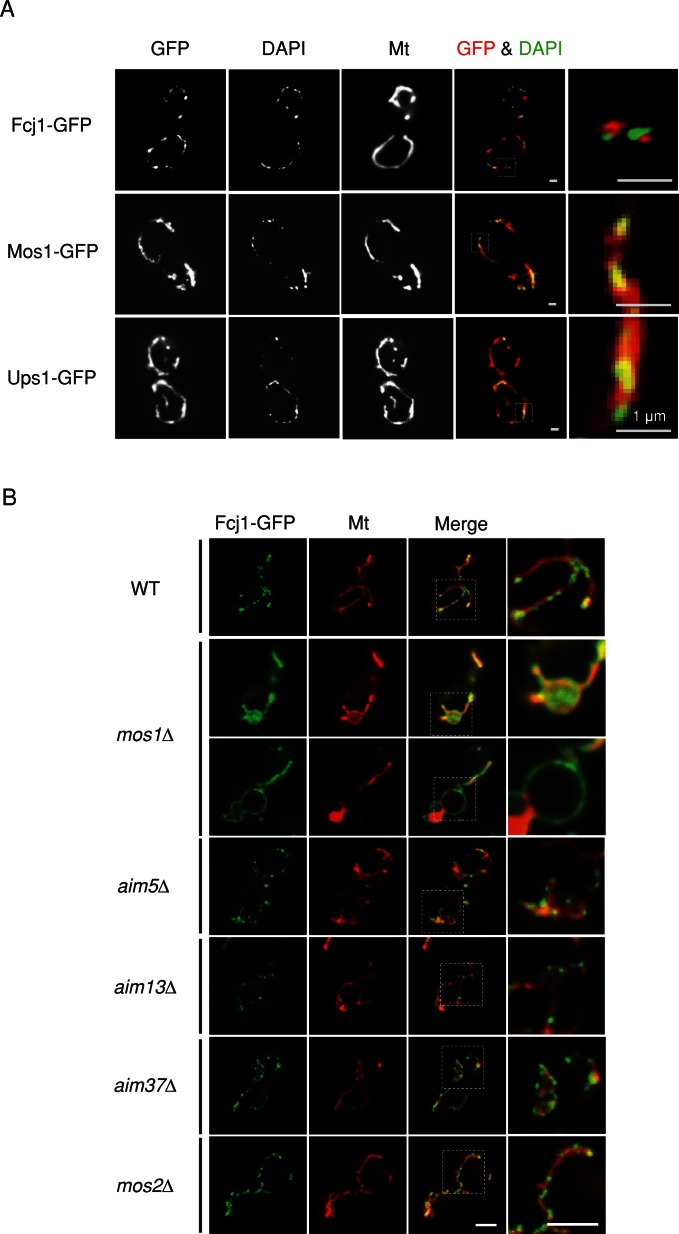
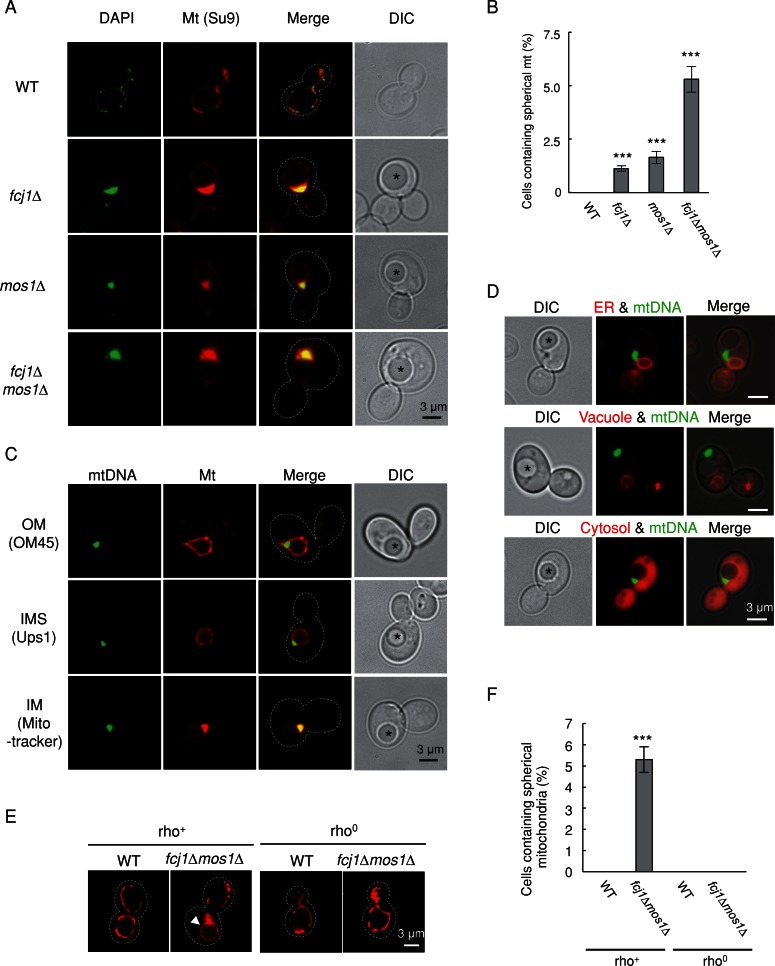
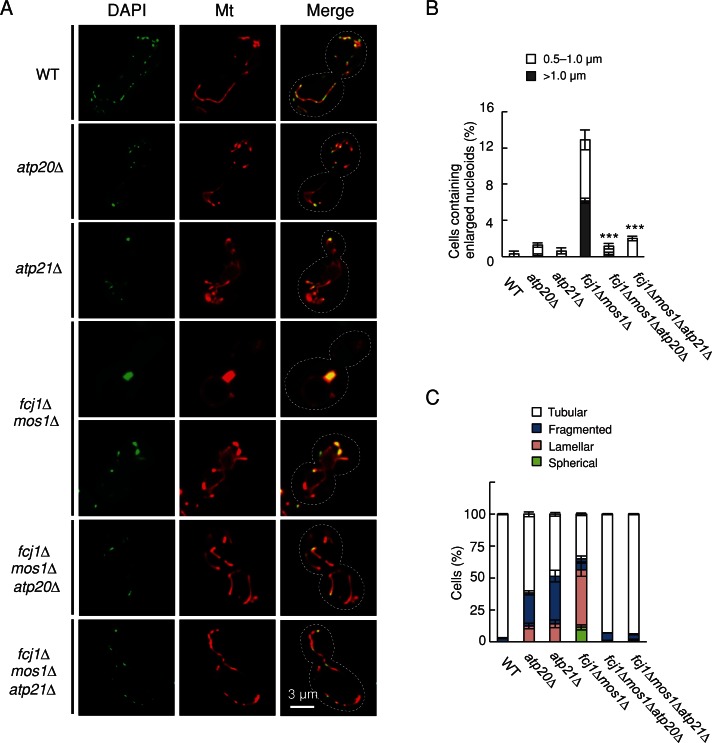
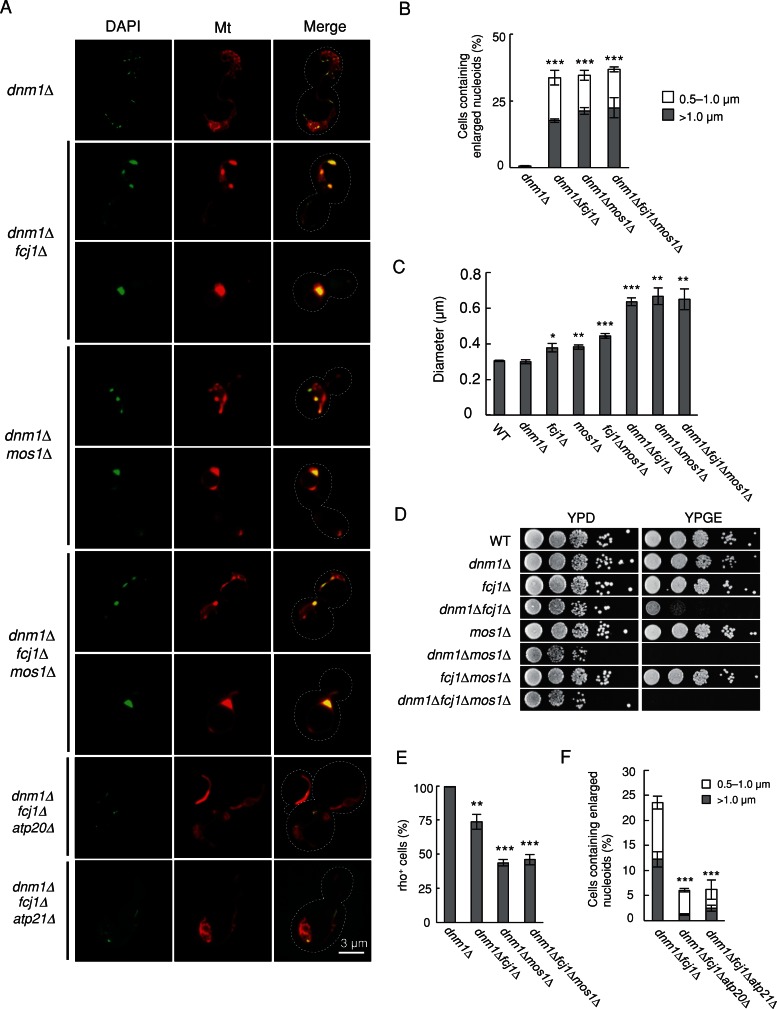
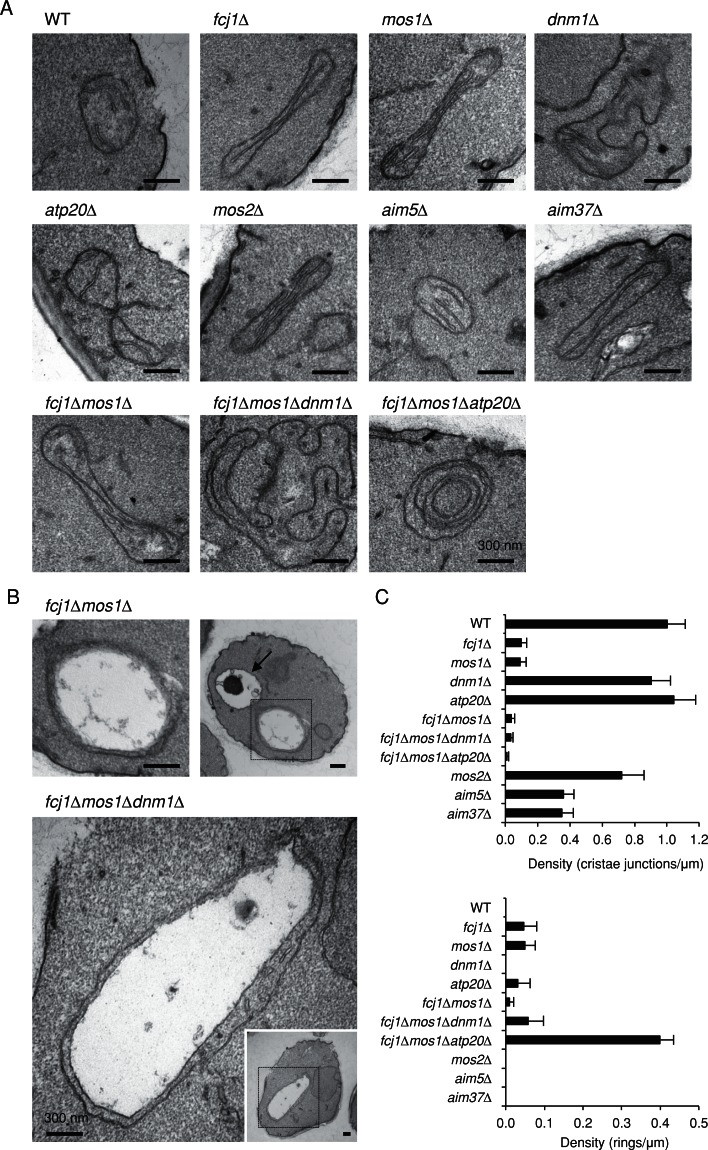
Mitochondrial DNA (mtDNA) is packaged into DNA-protein complexes called nucleoids, which are distributed as many small foci in mitochondria. Nucleoids are crucial for the biogenesis and function of mtDNA. Here, using a yeast genetic screen for components that control nucleoid distribution and size, we identify Fcj1 and Mos1, two evolutionarily conserved mitochondrial proteins that maintain the connection between the cristae and boundary membranes. These two proteins are also important for establishing tubular morphology of mitochondria, as mitochondria lacking Fcj1 and Mos1 form lamellar sheets. We find that nucleoids aggregate, increase in size, and decrease in number in fcj1 and mos1 cells. In addition, Fcj1 form punctate structures and localized adjacent to nucleoids. Moreover, connecting mitochondria by deleting the DNM1 gene required for organelle division enhances aggregation of mtDNA nucleoids in fcj1 and mos1 cells, whereas single deletion of DNM1 does not affect nucleoids. Conversely, deleting F1Fo-ATP synthase dimerization factors generates concentric ring-like cristae, restores tubular mitochondrial morphology, and suppresses nucleoid aggregation in these mutants. Our findings suggest an unexpected role of Fcj1-Mos1 and organelle division in maintaining the distribution and size of mtDNA nucleoids.
Figures
Similar articles
-
Formation of cristae and crista junctions in mitochondria depends on antagonism between Fcj1 and Su e/g.J Cell Biol. 2009 Jun 15;185(6):1047-63. doi: 10.1083/jcb.200811099. J Cell Biol. 2009. PMID: 19528297 Free PMC article.
-
An evidence based hypothesis on the existence of two pathways of mitochondrial crista formation.Elife. 2016 Nov 16;5:e18853. doi: 10.7554/eLife.18853. Elife. 2016. PMID: 27849155 Free PMC article.
-
MINOS1 is a conserved component of mitofilin complexes and required for mitochondrial function and cristae organization.Mol Biol Cell. 2012 Jan;23(2):247-57. doi: 10.1091/mbc.E11-09-0774. Epub 2011 Nov 23. Mol Biol Cell. 2012. PMID: 22114354 Free PMC article.
-
Organization and dynamics of yeast mitochondrial nucleoids.Proc Jpn Acad Ser B Phys Biol Sci. 2017;93(5):339-359. doi: 10.2183/pjab.93.021. Proc Jpn Acad Ser B Phys Biol Sci. 2017. PMID: 28496055 Free PMC article. Review.
-
Role of the mitochondrial contact site and cristae organizing system in membrane architecture and dynamics.Biochim Biophys Acta Mol Cell Res. 2017 Apr;1864(4):737-746. doi: 10.1016/j.bbamcr.2016.05.020. Epub 2016 Sep 7. Biochim Biophys Acta Mol Cell Res. 2017. PMID: 27614134 Review.
Cited by
-
CHCHD10 mutations promote loss of mitochondrial cristae junctions with impaired mitochondrial genome maintenance and inhibition of apoptosis.EMBO Mol Med. 2016 Jan 1;8(1):58-72. doi: 10.15252/emmm.201505496. EMBO Mol Med. 2016. PMID: 26666268 Free PMC article.
-
The Maintenance of Mitochondrial DNA Integrity and Dynamics by Mitochondrial Membranes.Life (Basel). 2020 Aug 26;10(9):164. doi: 10.3390/life10090164. Life (Basel). 2020. PMID: 32858900 Free PMC article. Review.
-
Sar1, a Novel Regulator of ER-Mitochondrial Contact Sites.PLoS One. 2016 Apr 21;11(4):e0154280. doi: 10.1371/journal.pone.0154280. eCollection 2016. PLoS One. 2016. PMID: 27101143 Free PMC article.
-
Slc25a3-dependent copper transport controls flickering-induced Opa1 processing for mitochondrial safeguard.Dev Cell. 2024 Oct 7;59(19):2578-2592.e7. doi: 10.1016/j.devcel.2024.06.008. Epub 2024 Jul 9. Dev Cell. 2024. PMID: 38986607
-
Mitochondrial DNA: Distribution, Mutations, and Elimination.Cells. 2019 Apr 25;8(4):379. doi: 10.3390/cells8040379. Cells. 2019. PMID: 31027297 Free PMC article. Review.
References
-
- Adams A, Gottschling D, Kaiser C, Stearns T. Methods in Yeast Genetics. Plainview, NY: Cold Spring Harbor Laboratory Press; 1997.
-
- Bauer C, Herzog V, Bauer MF. Improved technique for electron microscope visualization of yeast membrane structure. Microsc Microanal. 2001;7:530–534. - PubMed
Publication types
MeSH terms
Substances
Grants and funding
LinkOut - more resources
Full Text Sources
Other Literature Sources
Molecular Biology Databases
