. 2013 Jul;110(2):441-55.
doi: 10.1152/jn.00679.2012. Epub 2013 Apr 24.

GABAergic transmission facilitates ictogenesis and synchrony between CA3, hilus, and dentate gyrus in slices from epileptic rats

Affiliations

GABAergic transmission facilitates ictogenesis and synchrony between CA3, hilus, and dentate gyrus in slices from epileptic rats

Boris Gafurov et al. J Neurophysiol. 2013 Jul.

Abstract

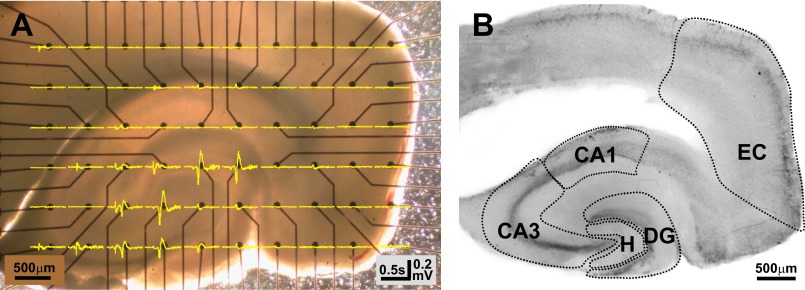
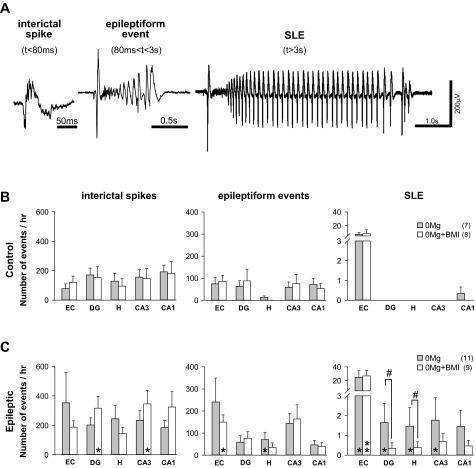
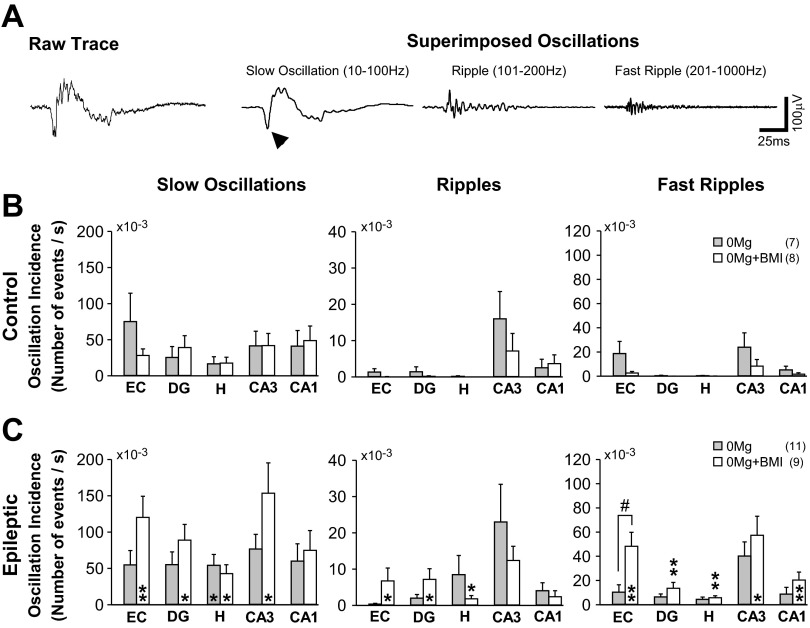
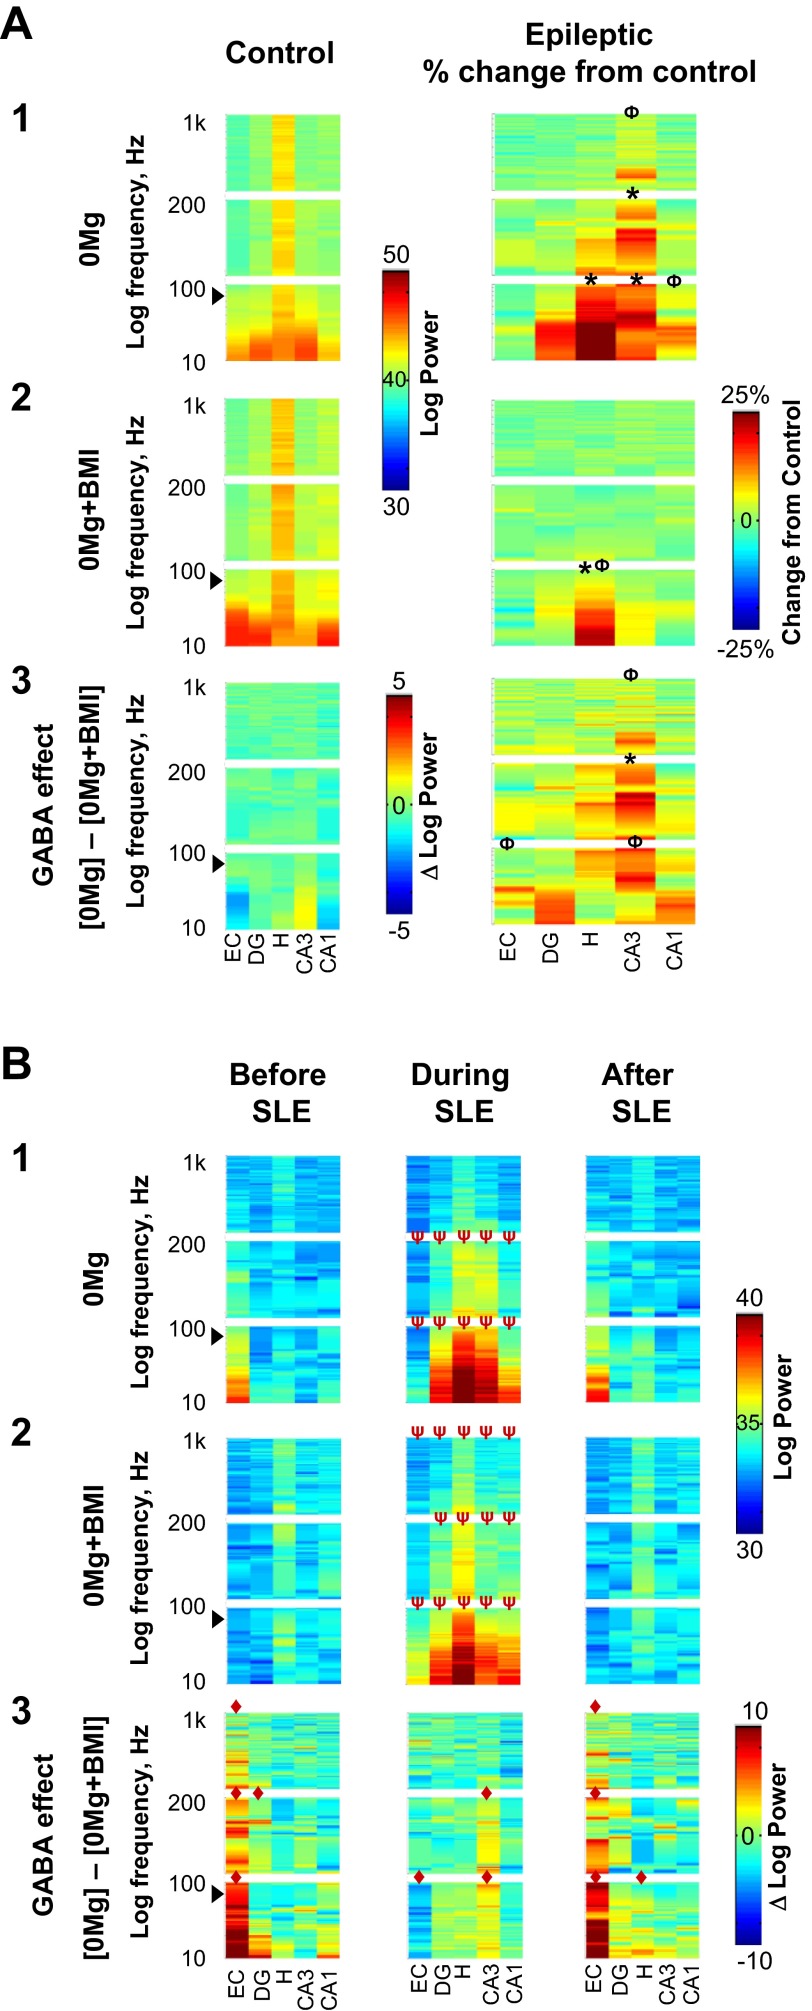
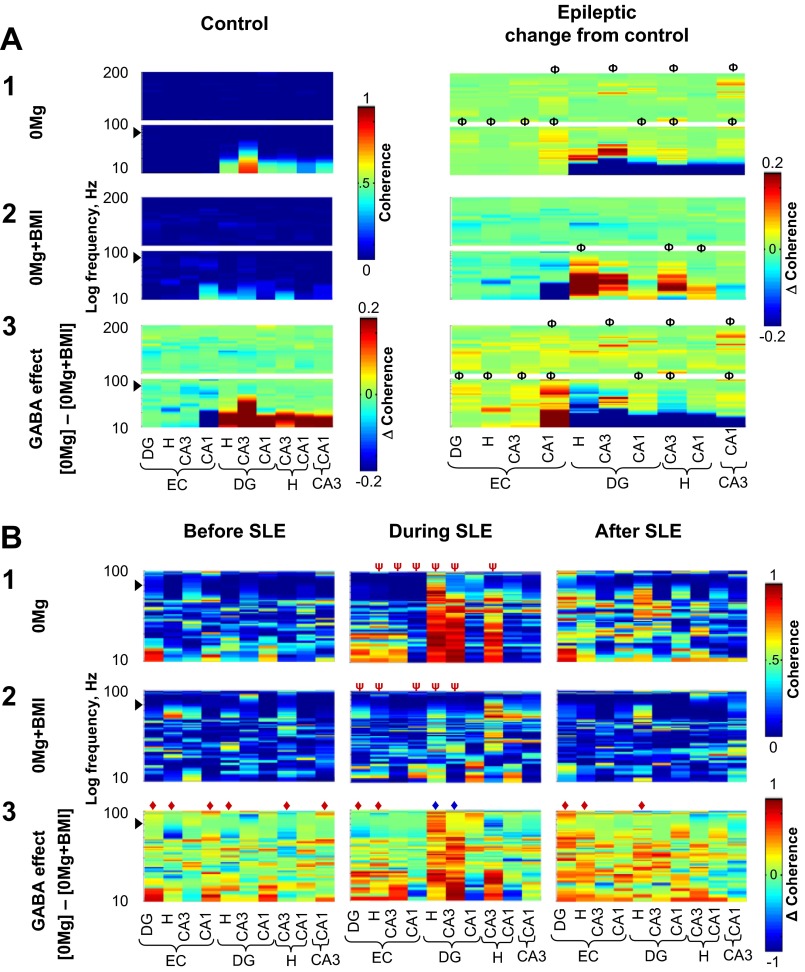
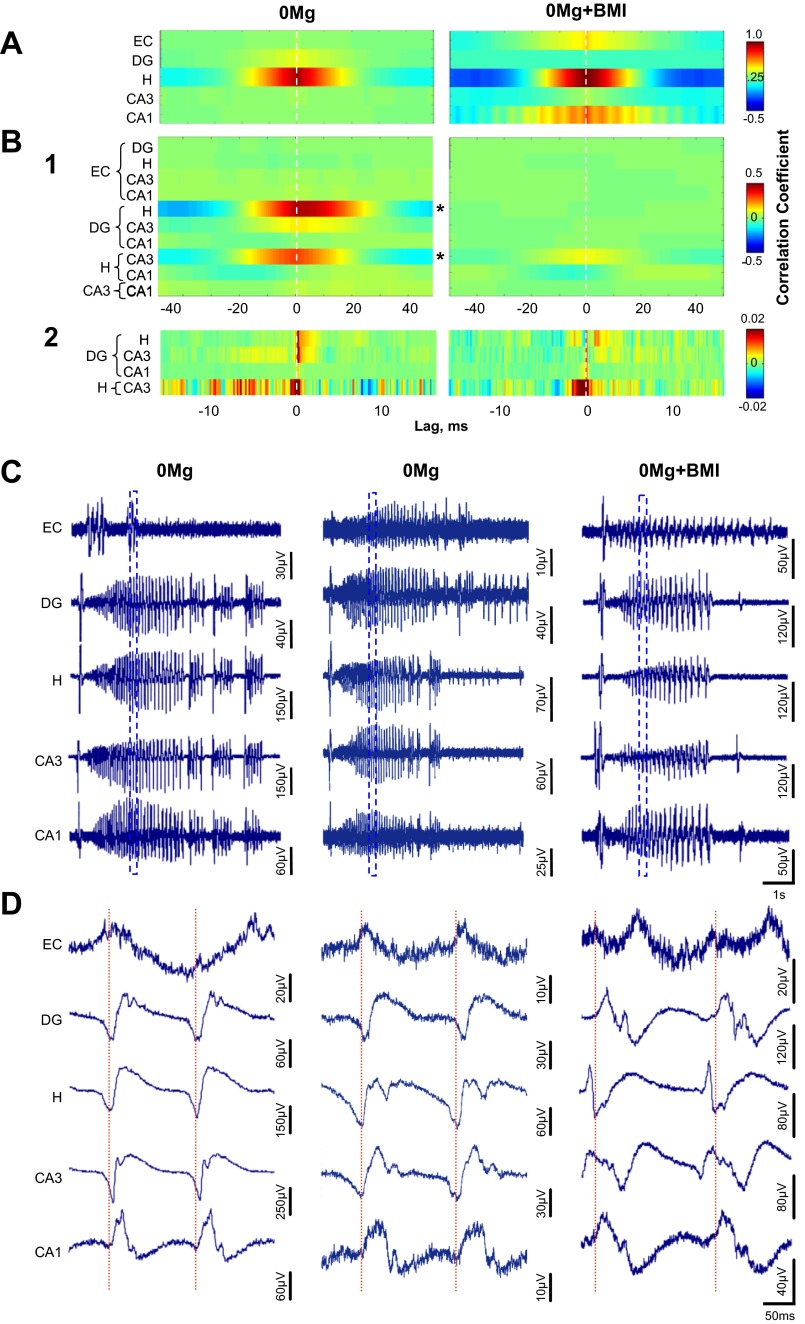
The impact of regional hippocampal interactions and GABAergic transmission on ictogenesis remain unclear. Cortico-hippocampal slices from pilocarpine-treated epileptic rats were compared with controls to investigate associations between seizurelike events (SLE), GABAergic transmission, and neuronal synchrony within and between cortico-hippocampal regions. Multielectrode array recordings revealed more prevalent hippocampal SLE in epileptic tissue when excitatory transmission was enhanced and GABAergic transmission was intact [removal of Mg(2+) (0Mg)] than when GABAergic transmission was blocked [removal of Mg(2+) + bicuculline methiodide (0Mg+BMI)]. When activity within individual regions was analyzed, spectral and temporal slow oscillation/SLE correlations and cross-correlations were highest within the hilus of epileptic tissue during SLE but were similar in 0Mg and 0Mg+BMI. GABAergic facilitation of spectral "slow" oscillation and ripple correlations was most prominent within CA3 of epileptic tissue during SLE. When activity between regions was analyzed, slow oscillation and ripple coherence was highest between the hilus and dentate gyrus as well as between the hilus and CA3 of epileptic tissue during SLE and was significantly higher in 0Mg than 0Mg+BMI. High 0Mg-induced SLE cross-correlations between the hilus and dentate gyrus as well as between the hilus and CA3 were reduced or abolished in 0Mg+BMI. SLE cross-correlation lag measurements provided evidence for a monosynaptic connection from the hilus to the dentate gyrus during SLE. Findings implicate the hilus as an oscillation generator, whose impact on other cortico-hippocampal regions is mediated by GABAergic transmission. Data also suggest that GABAA receptor-mediated transmission facilitates back-propagation from CA3/hilus to the dentate gyrus and that this back-propagation augments SLE in epileptic hippocampus.

Keywords: CA1; electrophysiology; entorhinal cortex; epilepsy; hilus; hippocampus; multielectrode array.


Figures

Fig. 1.
Fig. 1.
Electrical signals were assigned to distinct cortico-hippocampal subregions. Microelectrode array (MEA) electrodes were mapped and associated field potential recordings grouped into 5 distinct cortico-hippocampal subregions as described in materials and methods. A: representative photograph of a cortico-hippocampal slice from a control rat on a 6 × 10 MEA [electrodes appear as black dots with leads (black lines)]. Field potentials (yellow lines) recorded after superfusion with 0Mg at all 60 microelectrodes were overlaid onto the slice/MEA. B: the same 400-μm-thick slice depicted in A after staining with cresyl violet. Dotted lines delineate regions used to map electrodes and group field potential recordings. Since CA2 is ill-defined in rat, the region marked CA3 includes CA3 and CA2, as described by Amaral and Lavenex (2007). DG, dentate gyrus; EC, entorhinal cortex; H, hilus.
Fig. 2.
Fig. 2.
Seizurelike event (SLE) incidence was greater in slices from epileptic compared with control rats and was highest when excitatory transmission was enhanced and GABAergic transmission was intact. Electrographic events induced by 0Mg or 0Mg+BMI were detected and defined as described in materials and methods. A: representative interictal spike, epileptiform event, and SLE induced by 0Mg in a slice from an epileptic rat. B: in slices from control rats, interictal spikes (left) and epileptiform events (center) were detected in all cortico-hippocampal regions while SLE (right) occurred almost exclusively in the entorhinal cortex [entorhinal cortex vs. all hippocampal regions, P < 0.05, ANOVA on ranks with least significant difference (LSD) post hoc comparison], with rare SLE recorded in CA1. C: in slices from epileptic rats, interictal spikes (left), epileptiform events (center), and SLE (right) were detected in all cortico-hippocampal regions. SLE were more prevalent in 0Mg than 0Mg+BMI in hippocampus but not entorhinal cortex. Bars indicate means ± SE; no. of slices/rats is indicated in parentheses. Different from control, Mann-Whitney test: *P < 0.05, **P < 0.01. Different from 0Mg, ANOVA on ranks with LSD post hoc comparison: #P < 0.05. Vertical scale bar in A applies to all traces.
Fig. 3.
Fig. 3.
When excitatory transmission was enhanced with 0Mg, GABAergic transmission did not significantly affect dentate granule cell or CA3 pyramidal cell firing frequency. Firing frequencies of dentate granule cells (A) and CA3 pyramidal cells (B) in slices isolated from control (top) and epileptic (bottom) rats were measured after current steps with whole cell current-clamp recordings as described in materials and methods. All data points are depicted for individual cells in each experimental and recording condition. Although the resting membrane potential (in parentheses ± SE) was slightly more positive in 0Mg+BMI than in 0Mg, this shift was not significant (t-test, P > 0.05). Similarly, there was significant overlap in the distribution of firing in 0Mg and in 0Mg+BMI [best fit (r2 ≥ 0.9) with log-normal peak function, Kolmogorov-Smirnov test, P > 0.05], but there was a trend toward higher firing frequency in the −40 to −30 mV range in dentate granule cells from control rats (A, top) and in the −25 to −20 mV range for CA3 pyramidal cells from control (B, top) and epileptic (B, bottom) rats in 0Mg compared with 0Mg+BMI. n = 4–6 cells/slices/rats in each group.
Fig. 4.
Fig. 4.
Incidence of hippocampal oscillations in individual regions was not significantly affected by manipulations of excitatory and inhibitory activity. Slow oscillations, ripples, and fast ripples were detected and defined as described in materials and methods. A, left: representative raw recording of a 0Mg-induced interictal spike in CA3 of a slice from an epileptic rat. Right: the same trace separated into the superimposed slow oscillation [with overlying suprathreshold population spike (arrowhead; spike and wave complex), which forms the “backbone” of the interictal spike], ripple, and fast ripple. Similar superimposition of ripples and fast ripples on the slow oscillations/spike and wave complexes were evident during SLE (not shown). Potential contamination of slow oscillation measures with stand-alone population spikes (∼7 ms in duration) was minimized by exclusion of putative events ≤10 ms in duration. B and C: the incidence of slow oscillations (left), ripples (center), and fast ripples (right) in individual hippocampal regions for the entire duration of the recording was not significantly different in 0Mg and 0Mg+BMI but was significantly higher in slices from epileptic (C) compared with control (B) rats in 0Mg+BMI. Bars indicate means ± SE; no. of slices/rats is indicated in parentheses. *Different from control, t-test, P < 0.05. **Different from control, t-test, P < 0.01. #Different from other recording conditions, ANOVA with Sidak post hoc comparison, P < 0.05. Scale bars in A, right, apply to all traces.
Fig. 5.
Fig. 5.
When excitatory transmission was enhanced, hilar spectral slow oscillation correlation was elevated and GABAergic transmission facilitated CA3 spectral slow oscillation and ripple correlation. Correlation of oscillation frequencies in individual 0.5-s windows arising from different electrodes within individual regions were calculated for slices from control (A, left) and epileptic (A, right and B) rats; correlations were then compiled and compilations plotted as power spectra as described in materials and methods. Although stand-alone population spikes (∼7 ms in duration) were excluded from analysis, population spikes superimposed on suprathreshold slow oscillations may contaminate slow oscillation results at ∼71 Hz (arrowheads). The y-axis is stretched to yield equal height panels for each frequency range. A: correlations of each 0.5-s window recorded from different electrodes within an individual region were compiled for all 0.5-s windows in the entire duration of recording. A1: in 0Mg, spectral slow oscillation correlations within the hilus, CA3, and CA1 as well as spectral ripple and fast ripple correlations in CA3 were greater in slices from epileptic (n = 11) compared with control (n = 7) rats. A2: in 0Mg+BMI, only hilar spectral slow oscillation correlation was higher in epileptic (n = 9) compared with control (n = 8) rats. A3: subtraction of power spectra in A1 and A2 revealed that when excitatory transmission was enhanced, GABAergic transmission (right) facilitated spectral slow oscillation and ripple correlations within CA3 to a greater degree in slices from epileptic rats, which was significantly greater in epileptic compared with control rats. B: correlations were calculated for all 0.5-s windows in the 3 s immediately before SLE (left), the first 3 s of SLE (center), and the first 3 s after SLE termination (right) in slices from epileptic rats. The start of SLE was defined as described in materials and methods. B1: in 0Mg, spectral slow oscillation and ripple correlations were decreased in the entorhinal cortex and increased in the dentate gyrus, hilus, CA3, and CA1 during SLE compared with before and after SLE. B2: in 0Mg+BMI, spectral slow oscillation, ripple, and fast ripple correlations were increased in all hippocampal regions during compared with before and after SLE. B3: subtraction of power spectra in B1 and B2 revealed that when excitatory transmission was enhanced GABAergic transmission facilitated spectral slow oscillation, ripple, and fast ripple correlations within the entorhinal cortex immediately before and after SLE (left and right) and decreased entorhinal spectral slow oscillation correlation and facilitated spectral slow oscillation and ripple correlations within CA3 during SLE (center). *Overall range different from control, Φat least 1 peak wider than 5 Hz different from control, overall range difference between 0Mg and 0Mg+BMI, ψoverall range different from before and after SLE, P < 0.05, 2-way ANOVA with Sidak post hoc comparison. Scale bar in A1 and 2, left, applies to both left panels in A1 and 2; scale bar in A2, right, applies to all right panels in A1–3; scale bar in A3, left, applies only to that panel. Scale bar in B1 and 2, right, applies to all panels in B1 and 2; scale bar in B3, right, applies to all panels in B3.
Fig. 6.
Fig. 6.
When excitatory transmission was enhanced, slow oscillation coherence was highest between the hilus, dentate gyrus, and CA3 and GABAergic transmission facilitated slow oscillation coherence between CA3, hilus, and dentate gyrus during SLE. Oscillation coherence in individual 0.5-s windows recorded from electrodes in different regions was calculated for slices from control (A, left) and epileptic (A, right, and B) rats; coherence measures from experimental groups were then averaged and plotted as described in materials and methods. Although stand-alone population spikes (∼7 ms in duration) were excluded from analysis, population spikes superimposed on suprathreshold slow oscillations may contaminate slow oscillation results at ∼71 Hz (arrowheads). The y-axis is stretched to yield equal height panels for each frequency range. Coherence measures for fast ripples (201 Hz–1 kHz) in A and B and ripples (101–200 Hz) in B are not shown because there were no dramatic changes in these oscillation ranges across experimental groups. A: coherence measures of each 0.5-s window recorded from different electrodes across different regions were compiled for all 0.5-s windows in the entire duration of recording. In both 0Mg (A1) and 0Mg+BMI (A2), slow oscillation coherence was highest between the dentate gyrus, hilus, and CA3 and this coherence was shifted to higher slow oscillation frequency bands in epileptic (0Mg, n = 11; 0Mg+BMI, n = 9) compared with control (0Mg, n = 7; 0Mg+BMI, n = 8) tissue. In 0Mg (A1), but not 0Mg+BMI (A2), bands of ripple coherence between CA3 and other hippocampal regions were increased in slices from epileptic compared with control rats. A3: subtraction of coherences in A1 and A2 revealed that in slices from control rats (left), when excitatory transmission was enhanced GABAergic transmission facilitated slow oscillation coherence between hippocampal regions and reduced slow oscillation coherence between the entorhinal cortex and CA1. Right: when excitatory transmission was enhanced, GABAergic transmission facilitated slow oscillation coherence between CA3 and the dentate gyrus and reduced slow oscillation coherence between the hilus, dentate gyrus, and CA3 to a greater degree in slices from epileptic compared with control rats. GABAergic transmission also facilitated ripple coherence between CA3 and other hippocampal subregions to a greater degree in epileptic rats. B: coherences were calculated for all 0.5-s windows in the 3 s immediately before SLE (left), the first 3 s of SLE (center), and the first 3 s after SLE termination (right) in slices from epileptic rats. The start of SLE was defined as described in materials and methods. In 0Mg (B1), but not 0Mg+BMI (B2), slow oscillation coherence between the dentate gyrus, hilus, and CA3 was increased during SLE compared with before and after SLE. B3: subtraction of coherence in B1 and B2 revealed that when excitatory transmission was enhanced GABAergic transmission facilitated oscillation coherence between the dentate gyrus, hilus and CA3 during SLE (center, blue ◆) compared with before and after SLE. ΦAt least 1 peak wider than 5 Hz different from control, overall range difference between 0Mg and 0Mg+BMI, ψoverall range different than before and after SLE, P < 0.05, 2-way ANOVA with Sidak post hoc comparison. Scale bar in A1 and 2, left, applies to both left panels in A1 and 2; scale bar in A2, right, applies to all right panels in A1–3; scale bar in A3, left, applies only to that panel. Scale bar in B1 and 2, right, applies to all panels in B1 and 2; scale bar in B3, right, applies to all panels in B3.
Fig. 7.
Fig. 7.
When excitatory transmission was enhanced, GABAergic transmission was not required for SLE cross-correlation within the hilus but was required for SLE cross-correlation between the hilus and other hippocampal regions. Cross-correlations vs. lag were calculated for 0Mg (left, n = 11 slices/rats)- and 0Mg+BMI (right, n = 9 slices/rats)-induced SLE in slices from epileptic rats as described in materials and methods. A: cross-correlations of waveforms recorded by different electrodes within an individual region were high in the hilus and were similar in 0Mg (left) and 0Mg+BMI (right). Right: weaker cross-correlations within the entorhinal cortex and CA1 were apparent in 0Mg+BMI, but they were not significantly different from 0Mg. B1: cross-correlations of waveforms recorded from electrodes in different regions were high between the hilus and the dentate gyrus and between the hilus and CA3 in 0Mg (left) and were significantly lower in 0Mg+BMI (right). B2: similar results were seen with the autoregressive moving average (ARMA) model prior to performing cross-correlations. Exceptions were a more prominent cross-correlation between CA3 and the dentate gyrus and a second series of cross-correlation peaks between CA3 and the hilus in 0Mg (left) but not 0Mg+BMI (right). Reference regions for the cross-correlation lags are on right. C: representative SLE recorded simultaneously from all cortico-hippocampal regions in 0Mg (left and center) and 0Mg+BMI (right). D: expanded time scale of traces enclosed by boxes in C illustrates slight time lags between the hilus, CA3, and dentate gyrus (left) and time lock between the hilus and CA3, with a slight time lag with the dentate gyrus in 0Mg (center), and time lock between CA3 and the hilus in 0Mg+BMI (right). *Difference between 0Mg and 0Mg+BMI, P < 0.05, 2-way ANOVA. Horizontal scale bar in C, bottom right, applies to all traces in C; horizontal scale bar in D, bottom right, applies to all traces D.

Similar articles

Cited by

References

    1. Amaral D, Lavenex P. Hippocampal neuroanatomy. In: The Hippocampus Book, edited by Andersen P, Morris R, Amaral D, Bliss T, O'Keefe J. Oxford, UK: Oxford Univ. Press, 2007
    1. Amaral DG, Witter MP. The three-dimensional organization of the hippocampal formation: a review of anatomical data. Neuroscience 31: 571–591, 1989 - PubMed
    1. Amaral DG. A Golgi study of cell types in the hilar region of the hippocampus in the rat. J Comp Neurol 182: 851–914, 1978 - PubMed
    1. Anderson WW, Lewis DV, Swartzwelder HS, Wilson WA. Magnesium-free medium activates seizure-like events in the rat hippocampal slice. Brain Res 398: 215–219, 1986 - PubMed
    1. Aradi I, Maccaferri G. Cell type-specific synaptic dynamics of synchronized bursting in the juvenile CA3 rat hippocampus. J Neurosci 24: 9681–9692, 2004 - PMC - PubMed

Publication types