. 2013 May 2;497(7447):127-31.
doi: 10.1038/nature12121. Epub 2013 Apr 24.

Extensive transcriptional heterogeneity revealed by isoform profiling

Affiliations

Extensive transcriptional heterogeneity revealed by isoform profiling

Vicent Pelechano et al. Nature. .

Abstract

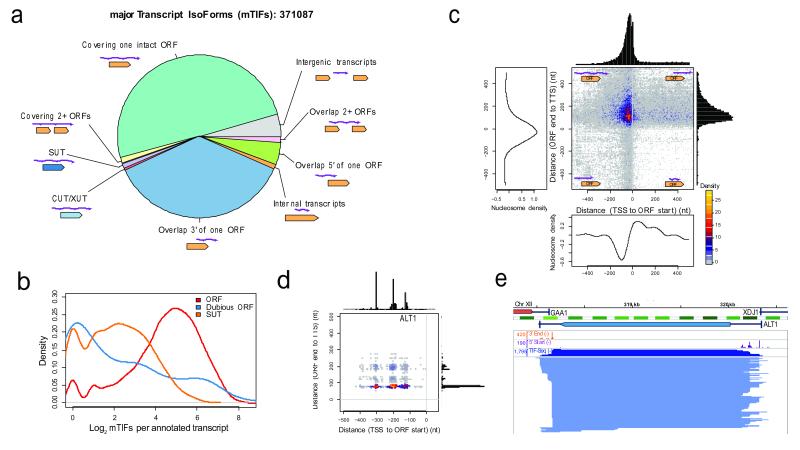
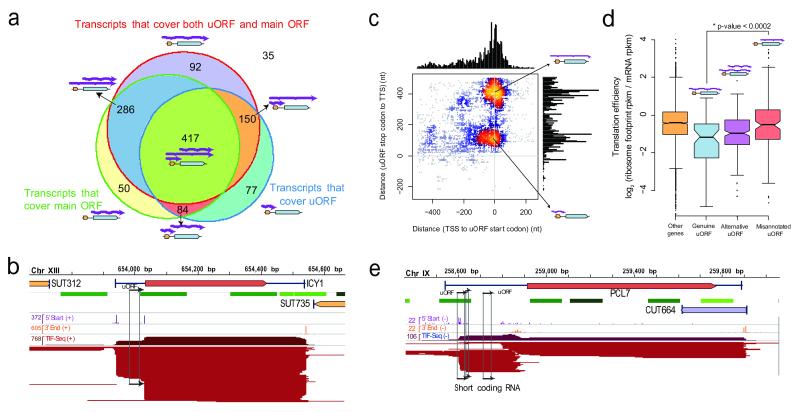
Transcript function is determined by sequence elements arranged on an individual RNA molecule. Variation in transcripts can affect messenger RNA stability, localization and translation, or produce truncated proteins that differ in localization or function. Given the existence of overlapping, variable transcript isoforms, determining the functional impact of the transcriptome requires identification of full-length transcripts, rather than just the genomic regions that are transcribed. Here, by jointly determining both transcript ends for millions of RNA molecules, we reveal an extensive layer of isoform diversity previously hidden among overlapping RNA molecules. Variation in transcript boundaries seems to be the rule rather than the exception, even within a single population of yeast cells. Over 26 major transcript isoforms per protein-coding gene were expressed in yeast. Hundreds of short coding RNAs and truncated versions of proteins are concomitantly encoded by alternative transcript isoforms, increasing protein diversity. In addition, approximately 70% of genes express alternative isoforms that vary in post-transcriptional regulatory elements, and tandem genes frequently produce overlapping or even bicistronic transcripts. This extensive transcript diversity is generated by a relatively simple eukaryotic genome with limited splicing, and within a genetically homogeneous population of cells. Our findings have implications for genome compaction, evolution and phenotypic diversity between single cells. These data also indicate that isoform diversity as well as RNA abundance should be considered when assessing the functional repertoire of genomes.


Figures

Figure 1
Figure 1. Genome-wide measurement of transcript isoform diversity using TIF-Seq
a, The TIF-Seq method consists of RNA oligo capping, generation of full-length cDNA, circularization, and paired-end sequencing. b-c, TIF boundaries agree overall with previous determinations of transcript 5′ starts (b) and 3′ ends (c) derived from tiling array annotations. As expected, TIF-Seq of non-capped mRNAs does not produce many 5′ reads at the annotated transcript start sites (b). d, Complex landscape of the yeast transcriptome in glucose, showing strand-specific RNA-Seq in comparison to TIF-Seq 5′ start and 3′ end profiles, as well as TIF-Seq coverage in logarithmic scale (dark red/blue upper tracks). Individual TIFs are represented by red or blue lines (Watson(+) or Crick(−) strand, respectively), each line designating one TIF. Nucleosome positions (green track, darkness indicates significance), expression measured by tiling arrays (blue heatmap; darkness indicates expression level), and genome annotation are shown in the centre: annotated ORFs (red and blue boxes for Watson and Crick strands, respectively), their UTRs (black lines), SUTs (yellow boxes), and CUTs (purple boxes). Coordinates are indicated in base pairs. SUT, stable unannotated transcript; CUT, cryptic unstable transcript.
Figure 2
Figure 2. Extensive isoform diversity revealed among overlapping RNA populations, both at the genomic and single-gene level
a, Categories of mTIFs identified in glucose and galactose. XUT, XRN1-sensitive unstable transcript. b, Log2-scale distribution of clustered mTIFs per annotated transcript that cover characterized or uncharacterized ORFs (ORFs), dubious ORFs, or overlap more than 80% of stable unannotated transcripts (SUTs). c, Transcript end distance to ORF stop codon (y-axis) vs. transcript start distance to ORF start codon (x-axis) genome-wide, revealing that most mTIFs cover the entire ORF. Decreased nucleosome density coincides with peaks in transcript start and end site distributions. d, Boundaries of TIFs covering ALT1 relative to ORF boundaries (as in c). e, Structure of TIFs overlapping ALT1 in glucose. 5′ start, 3′ end, and TIF-Seq coverage in natural scale. Nucleosome and genome annotations as in Fig. 1d.
Figure 3
Figure 3. Transcript isoforms with varying regulatory elements and independent short coding RNAs
a, Number of genes whose mTIFs overlap with previously annotated upstream ORFs (uORFs) and their associated (main) ORFs. b, ICY1 transcripts in glucose display alternative presence of uORFs (marked with arrows). c, Genome-wide plot of uORF-containing mTIFs: transcript end distance to uORF stop codon (y-axis) vs. transcript start distance to uORF start codon (x-axis). Small coding RNAs previously misannotated as uORFs represent a separate population of short overlapping RNAs. d, Genes with mTIFs that always contain uORFs display lower translation efficiency than those for which the uORF is independently transcribed. Genes with alternative presence of uORFs (e.g., ICY1) display intermediate translation efficiency. Significance was computed using the Wilcoxon rank sum test with continuity correction. e, Example of an scRNA that was previously misannotated as a uORF in the PCL7 locus (glucose data shown).
Figure 4
Figure 4. Alternative transcript isoforms increase coding diversity
a, Differential isoform regulation between glucose and galactose produces alternative truncated proteins with differential cellular localization, as shown here for SUC2. This regulation is due to subtle variations in TSS selection (5′ start track in purple) that result in alternative inclusion of the first AUG. b, Genes producing truncated transcripts that skip the first AUG (80% of these TIFs start between the first and second AUG) are effectively translated and display the expected codon usage pattern and ribosomal protection (green) in ribosome profiling data, starting at but not before the second in-frame methionine codon. c, Proportion of N-terminal truncated TIFs, (i.e., using the second methionine as start codon) in glucose and galactose. d, Internal polyadenylation events that introduce novel stop codons encode truncated ORFs and potentially alternative protein isoforms, as shown here for GAL10.

Comment in

References

    1. Djebali S, et al. Landscape of transcription in human cells. 1Nature. 2012;489:101–108. doi:10.1038/nature11233. - PMC - PubMed
    1. Di Giammartino DC, Nishida K, Manley JL. Mechanisms and consequences of alternative polyadenylation. Mol Cell. 2011;43:853–866. doi:10.1016/j.molcel.2011.08.017. - PMC - PubMed
    1. Carlson M, Botstein D. Two differentially regulated mRNAs with different 5′ ends encode secreted with intracellular forms of yeast invertase. Cell. 1982;28:145–154. - PubMed
    1. Ungewitter E, Scrable H. Delta40p53 controls the switch from pluripotency to differentiation by regulating IGF signaling in ESCs. Genes Dev. 2010;24:2408–2419. doi:10.1101/gad.1987810. - PMC - PubMed
    1. Xu Z, et al. Bidirectional promoters generate pervasive transcription in yeast. Nature. 2009;457:1033–1037. - PMC - PubMed

Publication types

MeSH terms

Associated data