. 2013 Aug;14(4):451-64.
doi: 10.1007/s10162-013-0388-x. Epub 2013 Apr 25.

Conductive hearing loss induced by experimental middle-ear effusion in a chinchilla model reveals impaired tympanic membrane-coupled ossicular chain movement

Affiliations

Conductive hearing loss induced by experimental middle-ear effusion in a chinchilla model reveals impaired tympanic membrane-coupled ossicular chain movement

Jennifer L Thornton et al. J Assoc Res Otolaryngol. 2013 Aug.

Erratum in

  • J Assoc Res Otolaryngol. 2013 Aug;14(4):465. Tollin, Daniel [corrected to Tollin, Daniel J]

Abstract

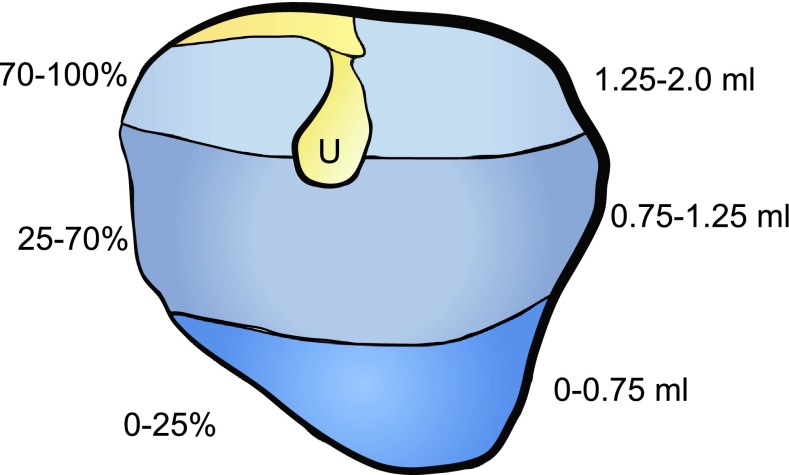
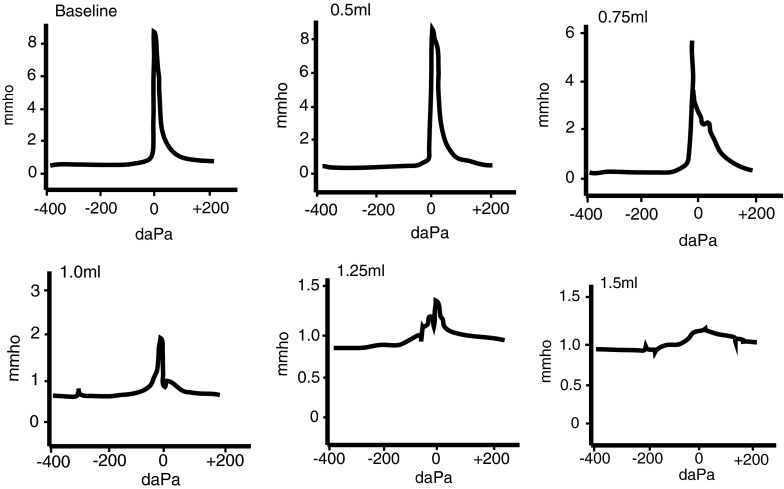
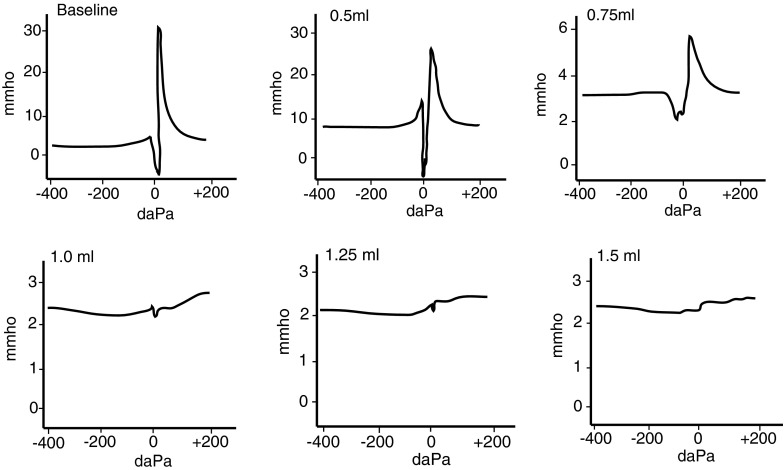
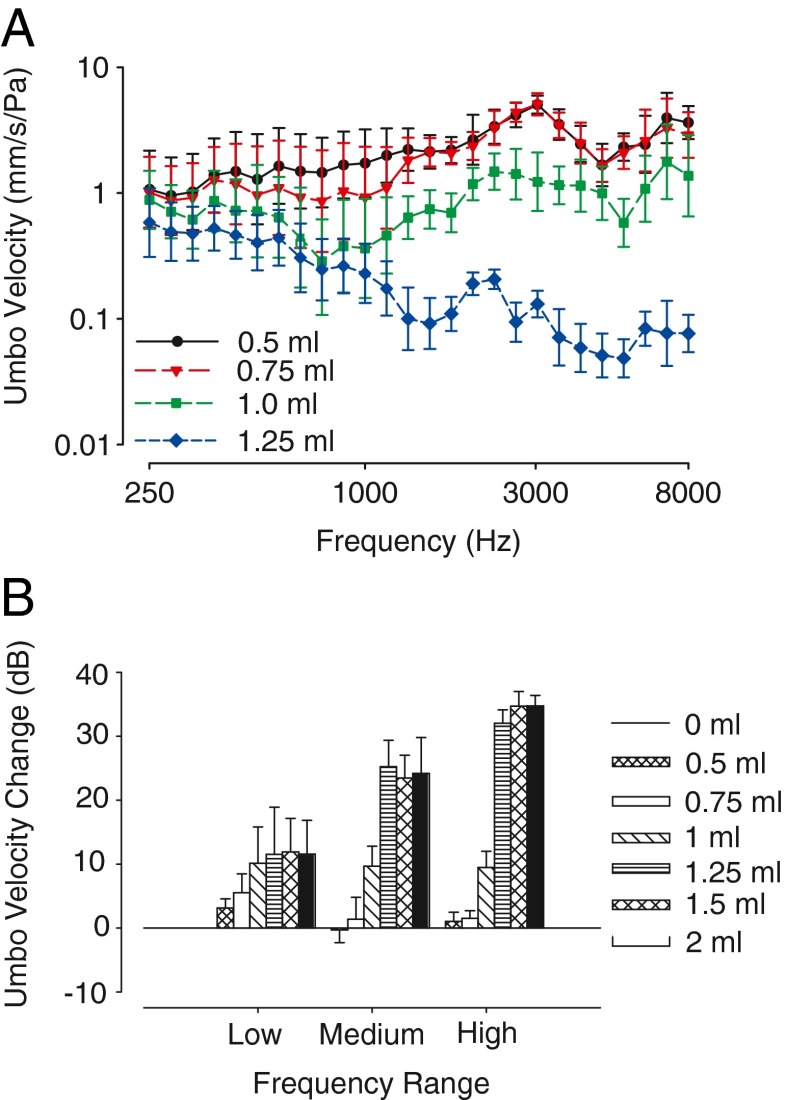
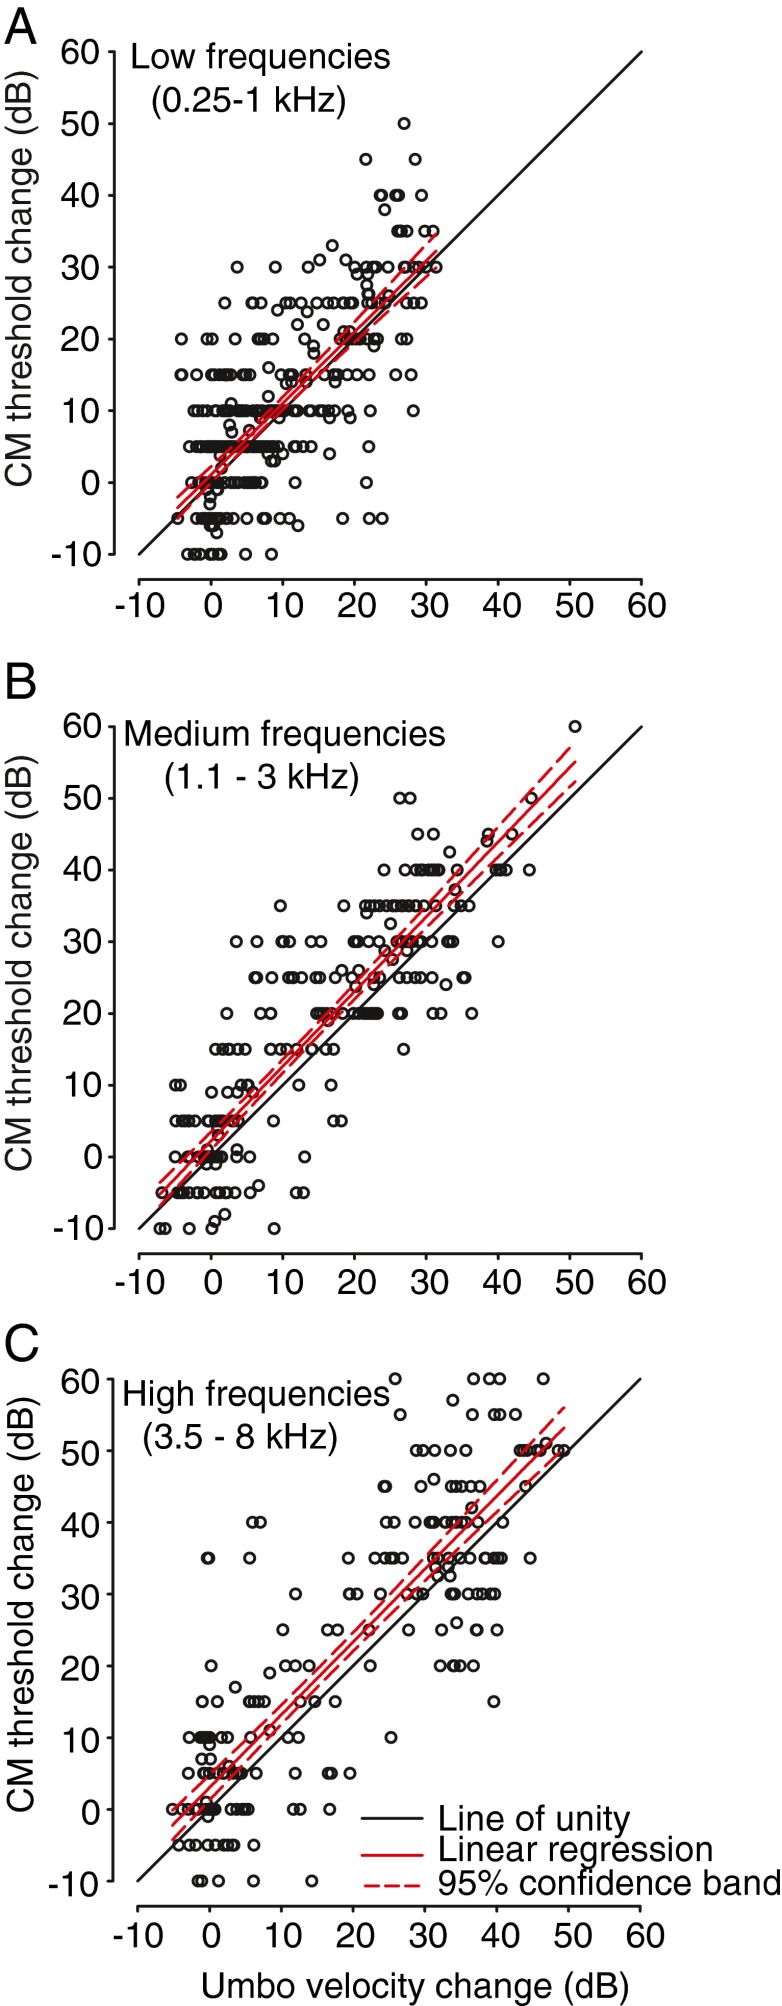
Otitis media with effusion (OME) occurs when fluid collects in the middle-ear space behind the tympanic membrane (TM). As a result of this effusion, sounds can become attenuated by as much as 30-40 dB, causing a conductive hearing loss (CHL). However, the exact mechanical cause of the hearing loss remains unclear. Possible causes can include altered compliance of the TM, inefficient movement of the ossicular chain, decreased compliance of the oval window-stapes footplate complex, or altered input to the oval and round window due to conduction of sound energy through middle-ear fluid. Here, we studied the contribution of TM motion and umbo velocity to a CHL caused by middle-ear effusion. Using the chinchilla as an animal model, umbo velocity (V U) and cochlear microphonic (CM) responses were measured simultaneously using sinusoidal tone pip stimuli (125 Hz-12 kHz) before and after filling the middle ear with different volumes (0.5-2.0 mL) of silicone oil (viscosity, 3.5 Poise). Concurrent increases in CM thresholds and decreases in umbo velocity were noted after the middle ear was filled with 1.0 mL or more of fluid. Across animals, completely filling the middle ear with fluid caused 20-40-dB increases in CM thresholds and 15-35-dB attenuations in umbo velocity. Clinic-standard 226-Hz tympanometry was insensitive to fluid-associated changes in CM thresholds until virtually the entire middle-ear cavity had been filled (approximately >1.5 mL). The changes in umbo velocity, CM thresholds, and tympanometry due to experimentally induced OME suggest CHL arises primarily as a result of impaired TM mobility and TM-coupled umbo motion plus additional mechanisms within the middle ear.


Figures

FIG. 1
FIG. 1
Observed fluid levels at the tympanic membrane. Silicone oil was mixed with food coloring to visualize the amount of TM that was covered by fluid during the fluid instillation process. With 0.75 mL of silicone oil in the middle-ear space, 25 % of the overall TM area was covered with fluid. With 1.0 mL of silicone oil, the TM was ~70 % covered, and at 1.25 mL of silicone oil in the middle ear, the TM was 100 % covered by fluid. The location of the umbo is indicated by the letter U.
FIG. 2
FIG. 2
CM absolute thresholds and threshold changes as a result of middle-ear fluid volume. A Across-animal (n = 5 ears) mean CM threshold as a function of frequency; error bars indicate ±1 SD. As the volume of middle-ear fluid was increased from 0.5 mL, the CM thresholds increased. B The data in panel A were further analyzed by computing the MEE-induced change in CM thresholds relative to the baseline with no middle-ear fluid in three frequency ranges: low (0.25–1 kHz), medium (1–3 kHz), and high (3–8 kHz). With 0.5 and 0.75 mL of fluid in the middle ear, there was little change in the CM thresholds. For fluid volumes greater than 1.0 mL, there were substantial increases in CM thresholds in all frequency ranges, indicating a CHL. In the low-frequency range, the maximum change in CM thresholds (18 dB) was reached by 1.0 mL of fluid in the middle-ear space. Large increases in CM thresholds for medium- and high-frequency sounds were observed when 1.0 mL of fluid was present in the middle-ear space, with near maximum threshold increases occurring when volumes of 1.25 mL or more of fluid were present (100 % TM area–fluid contact). Maximum threshold increases for medium- and high-frequency ranges were 30 and 42 dB, respectively. Baseline measurements are not shown as they are not significantly different from 0.5-mL fluid instillation values for CM thresholds.
FIG. 3
FIG. 3
The 226-Hz clinic-standard tympanometry with various volumes of silicone oil in the middle ear. The 226-Hz tympanometry did not yield type B tympanograms consistent with MEEs until the middle-ear space was nearly completely filled with fluid (1.5 mL). With 0.75 mL of fluid in the middle ear, at least 25 % of the TM is in contact with the fluid (Fig. 1). Some widening of the tympanometry curves is observed, but the tympanometry curve still resembles a type A tympanogram. At 1.25 mL of fluid in the middle ear (100 % TM area covered), the tympanometry curve still retains a small peak around 0 daPa.
FIG. 4
FIG. 4
High-frequency tympanometry (1,400 Hz) with various volumes of silicone oil in the middle ear. Type B tympanograms were more common when using a 1,400-Hz probe tone for tympanometry measurements. At 1,400 Hz, subtle changes in the tympanometry curve width were noticeable even with the first 0.5 mL of added middle-ear fluid. With 0.75 mL of fluid in the middle ear, the curves were noticeably shorter and wider. Type B tympanograms were seen at 1.0 mL of fluid in the middle ear. Across all animals, fluid levels above 1.0 mL resulted in type B tympanograms when using high-frequency probes.
FIG. 5
FIG. 5
Umbo velocity is reduced with increasing volume of middle-ear fluid. A Across-animal (n = 5 ears) mean umbo velocity transfer function (millimeter per second er Pascal) as a function of frequency; error bars indicate ±1 SD. As the volume of middle-ear fluid was increased from 0.5 mL, the mobility of the TM was reduced as indicated by a reduction in TM velocity. B The data in panel A were further analyzed by computing the MEE-induced change in umbo velocities relative to the baseline with no middle-ear fluid in three frequency ranges: low (0.25–1 kHz), medium (1–3 kHz), and high (3–8 kHz). For low-frequency sound stimuli, umbo velocity decreased with the addition of 0.5 mL of fluid in the middle ear. Additional umbo velocity decreases occurred with 0.75 mL and 1.0 mL of instilled fluid. Maximum changes in umbo velocities for low frequencies (~10 dB) were reached by 1.0 mL of middle-ear fluid. For medium- and high-frequency sound stimuli, decreases in umbo velocity initially occurred at 1.0 mL of fluid in the middle-ear space. Additional decreases in umbo velocity occurred with 1.25 mL of fluid in the middle ear, with no significant difference in umbo velocity decrease occurring above 1.25 mL of fluid. Maximum decrease in umbo velocity for medium- and high-frequency sounds was ~25 and ~35 dB, respectively. Baseline measurements are not shown as they are not significantly different from 0.5-mL fluid instillation values for umbo velocity measurements.
FIG. 6
FIG. 6
Correlation between middle-ear fluid induced changes in CM thresholds and umbo velocities for the A low-, B medium-, and C high-frequency ranges. Positive values indicate increased CM thresholds (i.e., increased CHL) and decreased umbo velocities, respectively. For each frequency range, with increases in the volume of fluid in the middle ear, there was a significant positive correlation between the CM threshold increases and umbo velocity decreases (see main text). The completely filled middle ear caused a frequency-dependent 20–40-dB increase in CM thresholds (Fig. 2), but only a 15–35-dB attenuation in umbo velocities (Fig. 5). In each panel, the solid black line indicates the unity line (slope = 1.0 dB/dB), the thick red line indicates the linear regression function relating changes in CM thresholds to changes in umbo velocity, and the dashed lines indicate the 95 % confidence interval for the regression function.

Similar articles

Cited by

References

    1. Bennett MJ, Weatherby LA. Newborn acoustic reflexes to noise and pure-tone signals. J Speech Hear Res. 1982;25:383–387. - PubMed
    1. Bluestone CD, Klein JO (eds) (1995) Definitions, terminology, and classification. In: Otitis media in infants and children, 2nd edn. W.B. Saunders Co., Philadelphia p 1–3
    1. Bluestone CD, Beery QC, Paradise JL. Audiometry and tympanometry in relation to middle ear effusions in children. Laryngoscope. 1973;83:594–604. doi: 10.1288/00005537-197304000-00015. - DOI - PubMed
    1. Brown DT, Marsh RR, Potsic WP. Hearing loss induced by viscous fluids in the middle ear. Int J Pediatr Otorhinolaryngol. 1983;5:39–46. doi: 10.1016/S0165-5876(83)80006-8. - DOI - PubMed
    1. Browning GC, Granich M. Surgical anatomy of the temporal bone in the chinchilla. Ann Otol Rhinol Laryngol. 1978;87:875–882. - PubMed

Publication types

LinkOut - more resources