Role of central metabolism in the osmoadaptation of the halophilic bacterium Chromohalobacter salexigens
- PMID: 23615905
- PMCID: PMC3682576
- DOI: 10.1074/jbc.M113.470567
Role of central metabolism in the osmoadaptation of the halophilic bacterium Chromohalobacter salexigens
Abstract
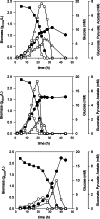
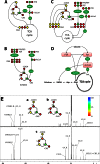
Bacterial osmoadaptation involves the cytoplasmic accumulation of compatible solutes to counteract extracellular osmolarity. The halophilic and highly halotolerant bacterium Chromohalobacter salexigens is able to grow up to 3 m NaCl in a minimal medium due to the de novo synthesis of ectoines. This is an osmoregulated pathway that burdens central metabolic routes by quantitatively drawing off TCA cycle intermediaries. Consequently, metabolism in C. salexigens has adapted to support this biosynthetic route. Metabolism of C. salexigens is more efficient at high salinity than at low salinity, as reflected by lower glucose consumption, lower metabolite overflow, and higher biomass yield. At low salinity, by-products (mainly gluconate, pyruvate, and acetate) accumulate extracellularly. Using [1-(13)C]-, [2-(13)C]-, [6-(13)C]-, and [U-(13)C6]glucose as carbon sources, we were able to determine the main central metabolic pathways involved in ectoines biosynthesis from glucose. C. salexigens uses the Entner-Doudoroff pathway rather than the standard glycolytic pathway for glucose catabolism, and anaplerotic activity is high to replenish the TCA cycle with the intermediaries withdrawn for ectoines biosynthesis. Metabolic flux ratios at low and high salinity were similar, revealing a certain metabolic rigidity, probably due to its specialization to support high biosynthetic fluxes and partially explaining why metabolic yields are so highly affected by salinity. This work represents an important contribution to the elucidation of specific metabolic adaptations in compatible solute-accumulating halophilic bacteria.
Keywords: Ectoines; Entner-Doudoroff; Halophilic Bacteria; Metabolic Tracers; Metabolism; Microbiology; Nuclear Magnetic Resonance; Overflow Metabolism; Pyruvate Carboxylase; Salt Adaptation.
Figures


Similar articles
-
Insights into metabolic osmoadaptation of the ectoines-producer bacterium Chromohalobacter salexigens through a high-quality genome scale metabolic model.Microb Cell Fact. 2018 Jan 9;17(1):2. doi: 10.1186/s12934-017-0852-0. Microb Cell Fact. 2018. PMID: 29316921 Free PMC article.
-
Understanding the interplay of carbon and nitrogen supply for ectoines production and metabolic overflow in high density cultures of Chromohalobacter salexigens.Microb Cell Fact. 2017 Feb 8;16(1):23. doi: 10.1186/s12934-017-0643-7. Microb Cell Fact. 2017. PMID: 28179004 Free PMC article.
-
Fructose metabolism in Chromohalobacter salexigens: interplay between the Embden-Meyerhof-Parnas and Entner-Doudoroff pathways.Microb Cell Fact. 2019 Aug 13;18(1):134. doi: 10.1186/s12934-019-1178-x. Microb Cell Fact. 2019. PMID: 31409414 Free PMC article.
-
[Study progress on compatible solutes in moderately halophilic bacteria].Wei Sheng Wu Xue Bao. 2007 Oct;47(5):937-41. Wei Sheng Wu Xue Bao. 2007. PMID: 18062278 Review. Chinese.
-
Microbial production of ectoine and hydroxyectoine as high-value chemicals.Microb Cell Fact. 2021 Mar 26;20(1):76. doi: 10.1186/s12934-021-01567-6. Microb Cell Fact. 2021. PMID: 33771157 Free PMC article. Review.
Cited by
-
Whole-genome sequencing and genome-scale metabolic modeling of Chromohalobacter canadensis 85B to explore its salt tolerance and biotechnological use.Microbiologyopen. 2022 Oct;11(5):e1328. doi: 10.1002/mbo3.1328. Microbiologyopen. 2022. PMID: 36314754 Free PMC article.
-
Neutrons describe ectoine effects on water H-bonding and hydration around a soluble protein and a cell membrane.Sci Rep. 2016 Aug 16;6:31434. doi: 10.1038/srep31434. Sci Rep. 2016. PMID: 27527336 Free PMC article.
-
Engineering the Salt-Inducible Ectoine Promoter Region of Halomonas elongata for Protein Expression in a Unique Stabilizing Environment.Genes (Basel). 2018 Mar 28;9(4):184. doi: 10.3390/genes9040184. Genes (Basel). 2018. PMID: 29597294 Free PMC article.
-
Osmoregulation in the Halophilic Bacterium Halomonas elongata: A Case Study for Integrative Systems Biology.PLoS One. 2017 Jan 12;12(1):e0168818. doi: 10.1371/journal.pone.0168818. eCollection 2017. PLoS One. 2017. PMID: 28081159 Free PMC article.
-
Anaplerotic Pathways in Halomonas elongata: The Role of the Sodium Gradient.Front Microbiol. 2020 Sep 25;11:561800. doi: 10.3389/fmicb.2020.561800. eCollection 2020. Front Microbiol. 2020. PMID: 33101236 Free PMC article.
References
-
- Cayol J. L., Ducerf S., Patel B. K., Garcia J. L., Thomas P., Ollivier B. (2000) Thermohalobacter berrensis gen. nov., sp. nov., a thermophilic, strictly halophilic bacterium from a solar saltern. Int. J. Syst. Evol. Microbiol. 50, 559–564 - PubMed
-
- Oren A., Mana L. (2003) Sugar metabolism in the extremely halophilic bacterium Salinibacter ruber. FEMS Microbiol. Lett. 223, 83–87 - PubMed
-
- Trotsenko IuA., Khelenina V. N. (2002) The biology and osmoadaptation of haloalkaliphilic methanotrophs. Mikrobiologia 71, 149–159 - PubMed
-
- Oren A., Heldal M., Norland S., Galinski E. A. (2002) Intracellular ion and organic solute concentrations of the extremely halophilic bacterium Salinibacter ruber. Extremophiles 6, 491–498 - PubMed
Publication types
MeSH terms
Substances
LinkOut - more resources
Full Text Sources
Other Literature Sources
Molecular Biology Databases

