Review
. 2013 May;6(3):580-93.
doi: 10.1242/dmm.009282.

Caught in the act: revealing the metastatic process by live imaging

Affiliations
Review

Caught in the act: revealing the metastatic process by live imaging

Miriam R Fein et al. Dis Model Mech. 2013 May.

Abstract

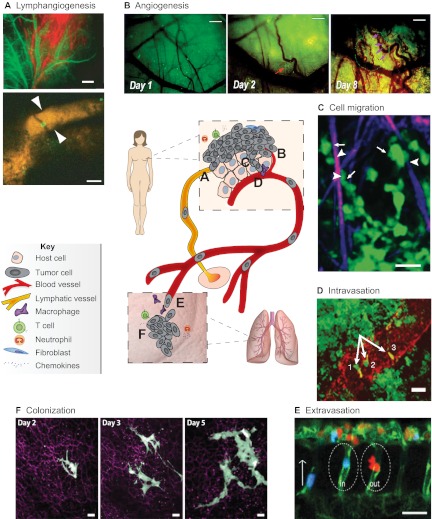
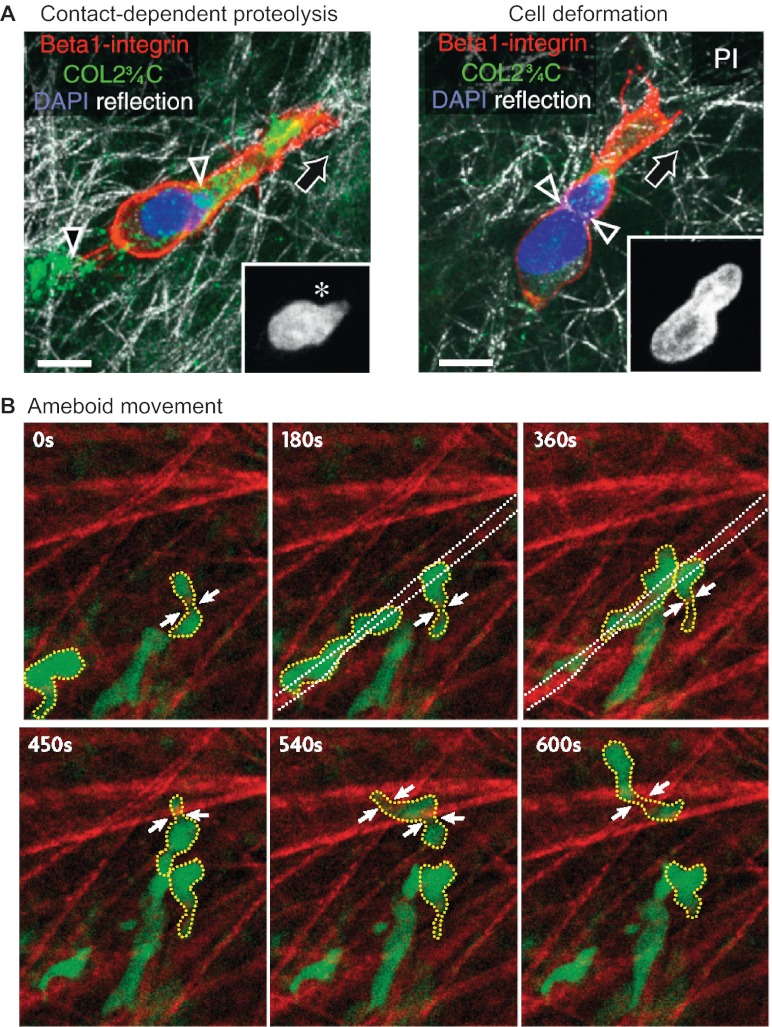
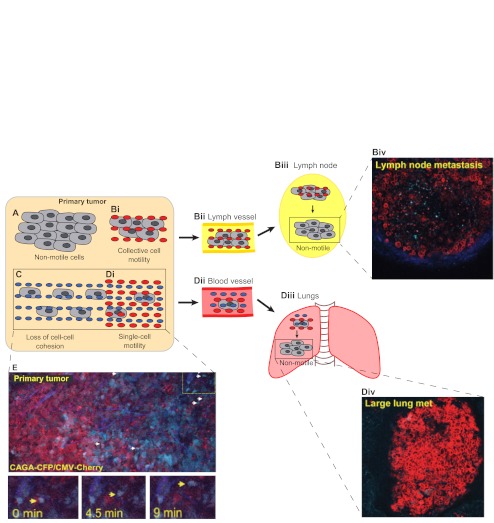
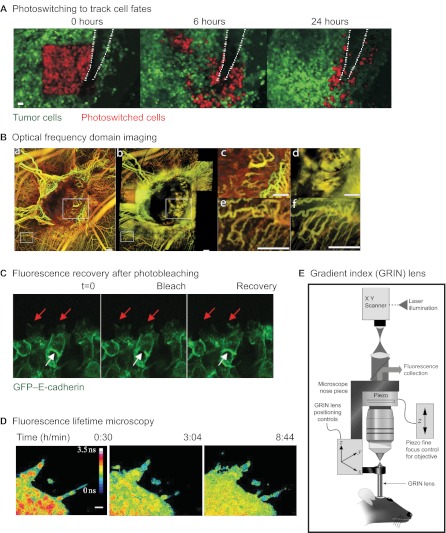
The prognosis of metastatic cancer in patients is poor. Interfering with metastatic spread is therefore important for achieving better survival from cancer. Metastatic disease is established through a series of steps, including breaching of the basement membrane, intravasation and survival in lymphatic or blood vessels, extravasation, and growth at distant sites. Yet, although we know the steps involved in metastasis, the cellular and molecular mechanisms of dissemination and colonization of distant organs are incompletely understood. Here, we review the important insights into the metastatic process that have been gained specifically through the use of imaging technologies in murine, chicken embryo and zebrafish model systems, including high-resolution two-photon microscopy and bioluminescence. We further discuss how imaging technologies are beginning to allow researchers to address the role of regional activation of specific molecular pathways in the metastatic process. These technologies are shedding light, literally, on almost every step of the metastatic process, particularly with regards to the dynamics and plasticity of the disseminating cancer cells and the active participation of the microenvironment in the processes.


Figures

Fig. 1.
Fig. 1.
Live imaging of the metastatic process. Central cartoon summarizes the metastatic stages detailed in A–F. (A) Top: blood (green) and lymphatic (red) vessels in an ear with a transplanted T241 fibrosarcoma cell line overexpressing the growth factor VEGF-C were visualized with simultaneous angiography and lymphangiography (using FITC- and TRITC-conjugated dextrans). Tumor blood and lymphatic vessels were dilated compared with normal ear (not shown). Scale bar: 850 μm. Bottom: GFP-positive T241 fibrosarcoma cells (green) in a lymphatic vessel (arrowheads; red; tetramethyl-rhodamine lymphangiography), traveling from the primary tumor to the cervical lymph node. Scale bar: 100 μm. Reprinted with permission (Hoshida et al., 2006). (B) Angiogenesis imaged in a dorsal skinfold window chamber by fluorescence microscopy after transplantation of GFP-labeled 4T1 mammary carcinoma cells (green) in a BALB/c mouse. Red arrow in the day 2 panel indicates an elongated cancer cell. In the day 8 panel, purple arrows point to microvessels within the tumor (localized in the marked circle), and red arrows point to dilated vasculature outside the tumor. Scale bars: 200 μm. Reprinted with permission (Li et al., 2000). (C) GFP-labeled MTLn3 mammary carcinoma cells (green) move along collagen fibers (purple), visualized by second-harmonic generation (SHG) imaging. Arrows are pointing to carcinoma cells, and arrowheads are pointing to cell-matrix interactions. Scale bar: 25 μm. Reprinted with permission (Condeelis and Segall, 2003). (D) Intravasation of GFP-labeled MTLn3 mammary carcinoma cells (green) into a dextran-labeled blood vessel (red) imaged by multiphoton microscopy. Three cells that have crossed into the blood vessel are yellow, indicated by arrows. Scale bar: 25 μm. Reprinted with permission (Condeelis and Segall, 2003). (E) Imaging extravasation in transgenic zebrafish embryos. Confocal image of a non-extravasating, wild-type (expressing CFP, colored blue) or extravasating and twist overexpressing (co-expressing RFP and colored red) MDA-MB-231 human breast cancer cell. Cells are shown near the intersegmental vessels (ISV) of a zebrafish embryo, inside (in) or extravasated (out) from the vessel lumen. Scale bar: 200 μm. Reprinted with permission (Stoletov et al., 2010). (F) The establishment of a micrometastasis (‘colonization’) in the liver of a BALB/c mouse. Mouse C26 colorectal carcinoma cells (cyan, expressing fluorescent Dendra2) shown by repeated imaging through an abdominal imaging window. Fibrillar collagens (purple) are detected by SHG imaging. Scale bars: 20 μm. Reprinted with permission (Ritsma et al., 2012).
Fig. 2
Fig. 2
Plasticity of cell migration: matrix metalloproteinases. (A) Protease-dependent and -independent migration. Black arrows indicate the direction of migration. β1-integrin staining is shown in red; proteolytically digested collagen (Col2¾C) staining in green; reflection indicates fibrillar extracellular matrix structures (white); DAPI staining of nuclei is shown in blue. Nuclei are shown in inserts. Scale bars: 10 μm. Left panel: contact-dependent proteolysis of migrating HT1080 fibrosarcoma cells overexpressing the metalloproteinase MT1-MMP in a three-dimensional collagen matrix. Contact-dependent proteolysis is indicated with an open arrowhead and the proteolytic path is indicated with a black arrowhead. The nucleus has maintained its ellipsoid shape (asterisk, insert). Right panel: protease-inhibited migration (in the presence of a broad spectrum protease inhibitor cocktail, PI) with deformation of the cell nucleus (arrowheads). The deformation is clearly visible in the insert. Reprinted with permission (Wolf and Friedl, 2011). (B) Non-proteolytic migration (amoeboid movement). GFP-expressing squamous cell carcinoma A431 cells (green) are shown moving into a collagen-rich matrix (red) surrounding a tumor (visualized with second harmonic generation). No proteolysis of the collagen fibers is seen. Arrows mark points of cell constriction. Field of view is 150×180 μm. Yellow dotted lines outline moving cells; white dotted lines represent a fiber that a carcinoma cell moves along. Time after initiation of imaging is indicated on the time series. Reprinted with permission (Sahai, 2007).
Fig. 3.
Fig. 3.
Signaling pathways in metastasis: the role of TGFβ. Model illustrating how combinations of signals within a primary tumor can direct the mode of cell motility. (A) Non-motile, cohesively packed cells in the primary tumor (no signal). (Bi) Cells receiving pro-motility cues (such as EGF; red circles), but not TGFβ, move cohesively and collectively via the lymphatic route (Bii), and metastasize to the lymph nodes (Biii), where the signal is lost and cells become non-motile. (Biv) Image of an MTLn3E lymph node metastasis constitutively expressing myristoylated Cherry (red) and CFP (cyan) from a SMAD-dependent promoter (not expressed by cells in the metastasis); collagen second harmonic signal is in blue. (C) High TGFβ signals (blue circles), without pro-motility cues, cause loss of cell-cell cohesion. (Di) Pro-motility cues with TGFβ together promote single-cell motility, entry into the blood (Dii), and lung metastases (Diii). (Div) Image of an MTLn3E lung metastasis constitutively expressing myristoylated Cherry (red) and CFP (cyan) from a SMAD-dependent promoter (not expressed by cells in the metastasis); collagen second harmonic signal is in blue. (E) A primary tumor originating from MTLn3E mammary carcinoma cells constitutively expressing myristoylated Cherry (red) and CFP (cyan) from a SMAD-dependent promoter; collagen second harmonic signal is in blue. White and yellow arrows indicate motile cells. The marked area is shown at higher magnification at 0, 4.5 and 9 minutes. Panels Biv, Div and E are reprinted with permission (Giampieri et al., 2009), and cartoons are adapted with permission from the American Association for Cancer Research (Giampieri et al., 2010).
Fig. 4.
Fig. 4.
Advances in imaging technologies. (A) Photoswitching using a mammary imaging window. Tumor cells are labeled with the photoswitchable protein Dendra2. Non-photoswitched cells (green) and photoswitched cells (red) are shown at 0, 6 and 24 hours after the photoswitch in vascular microenvironments. White dotted lines indicates a vessel. The photoswitched cells adjacent to the vessel disappear quickly over time, suggesting that they leave the primary tumor through intravasation. Scale bar: 30 μm. Reprinted with permission (Kedrin et al., 2008). (B) Three-dimensional microscopy using optical frequency domain imaging (OFDI) compared with multiphoton microscopy. Imaging of a murine mammary adenocarcinoma tumor in a dorsal skinfold chamber using OFDI is shown (a,c,e), compared with multiphoton microscopy (b,d,f). c-f are higher-magnification views of the corresponding areas outlined in white on panels a and b. OFDI is superior to multiphoton for visualizing vessels in deeper regions (c,d), whereas multiphoton microscopy has better resolution of finer structures in more superficial regions (e,f). Depth is denoted by color: yellow (superficial) to red (deep). Scale bars: 250 μm. Reprinted with permission (Vakoc et al., 2009). (C) Fluorescence recovery after photobleaching (FRAP). Images of FRAP experiments of GFP–E-cadherin performed at the front of a wound heal assay. Red arrows indicate cell protrusions, and white arrows point to the areas photobleached in the middle panel. Reprinted with permission (Timpson et al., 2009). (D) Fluorescence lifetime microscopy (FLIM) used to monitor uptake of doxorubicin, a chemotherapeutic drug, at the invasive front of a spheroid consisting of mouse mammary MMT-DC cells. Fluorescent lifetime is visualized before (left panel) and after (middle and right panels) treatment and shows a stepwise reduction of fluorescence lifetime. False-color range: 0 to 3.5 ns. Scale bar: 20 μm. Reprinted with permission (Bakker et al., 2012). (E) Use of the gradient index (GRIN) lens with a multiphoton microscope. One end of the GRIN lens is positioned close to the focal plane of the objective lens of a standard multiphoton laser-scanning microscope, with the opposite end inserted inside the animal. A piezoelectric focus control performs fine focusing without moving the GRIN lens. Reprinted with permission (Levene et al., 2004).

Similar articles

Cited by

References

    1. Aguirre-Ghiso J. A. (2007). Models, mechanisms and clinical evidence for cancer dormancy. Nat. Rev. Cancer 7, 834–846 - PMC - PubMed
    1. American Cancer Society (2011). Cancer Facts and Figures 2011. Atlanta, GA: American Cancer Society
    1. Bakker G. J., Andresen V., Hoffman R. M., Friedl P. (2012). Fluorescence lifetime microscopy of tumor cell invasion, drug delivery, and cytotoxicity. Methods Enzymol. 504, 109–125 - PubMed
    1. Beerling E., Ritsma L., Vrisekoop N., Derksen P. W., van Rheenen J. (2011). Intravital microscopy: new insights into metastasis of tumors. J. Cell Sci. 124, 299–310 - PMC - PubMed
    1. Bekes E. M., Schweighofer B., Kupriyanova T. A., Zajac E., Ardi V. C., Quigley J. P., Deryugina E. I. (2011). Tumor-recruited neutrophils and neutrophil TIMP-free MMP-9 regulate coordinately the levels of tumor angiogenesis and efficiency of malignant cell intravasation. Am. J. Pathol. 179, 1455–1470 - PMC - PubMed

Publication types