Randomized Controlled Trial
. 2013 Apr 24;33(17):7109-21.
doi: 10.1523/JNEUROSCI.1985-12.2013.

Vision dominates at the preresponse level and audition dominates at the response level in cross-modal interaction: behavioral and neural evidence

Affiliations
Randomized Controlled Trial

Vision dominates at the preresponse level and audition dominates at the response level in cross-modal interaction: behavioral and neural evidence

Qi Chen et al. J Neurosci. .

Abstract

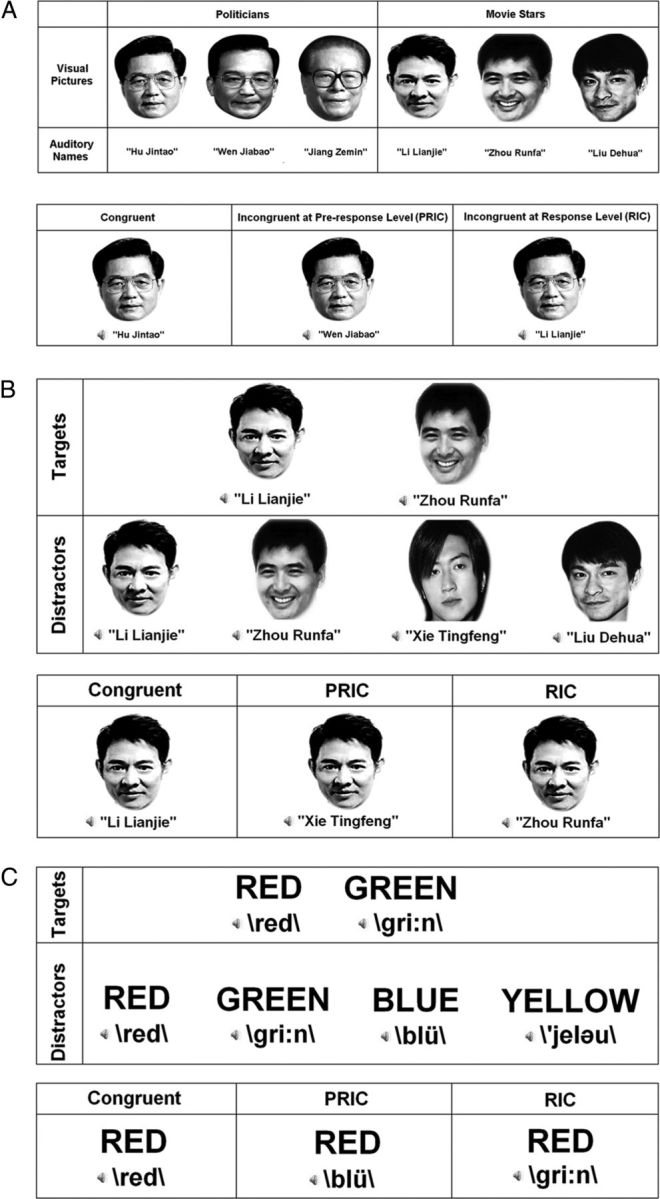
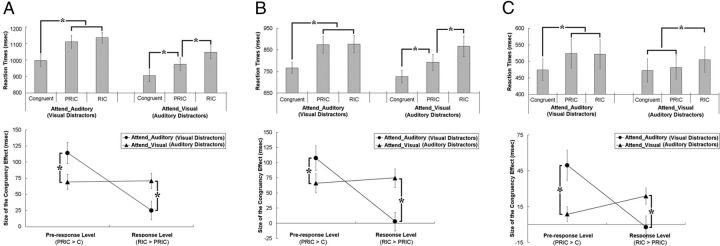
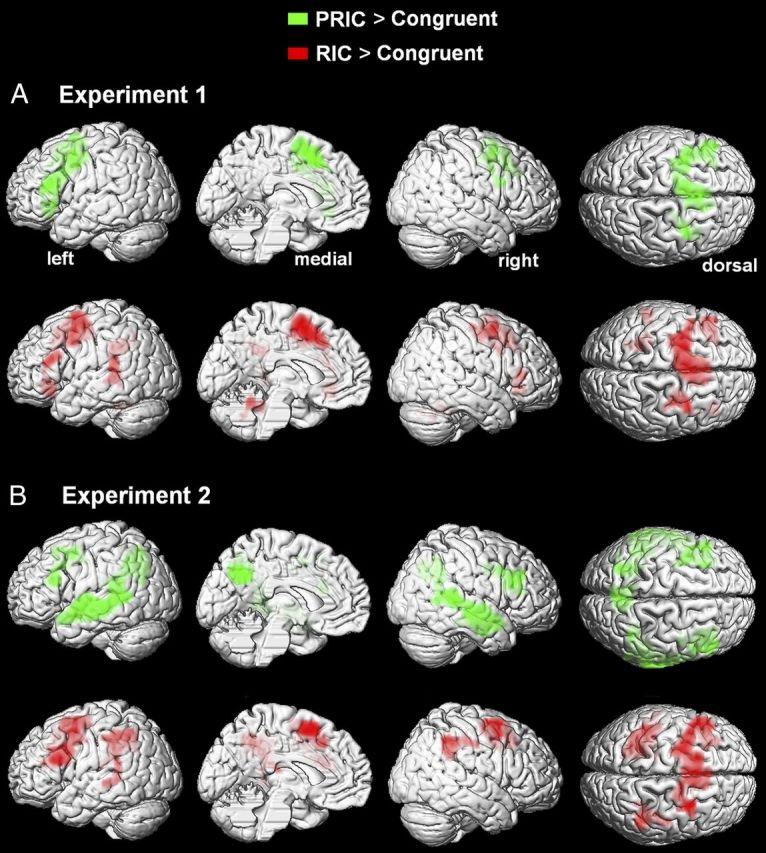
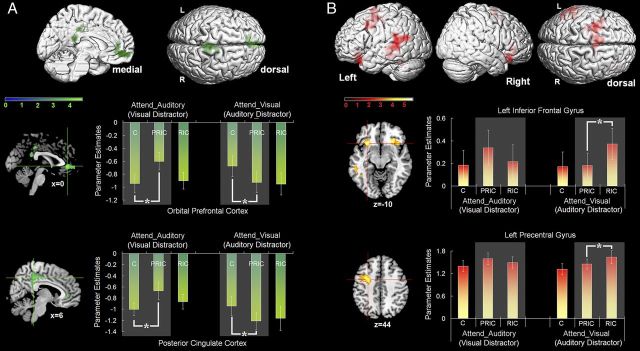
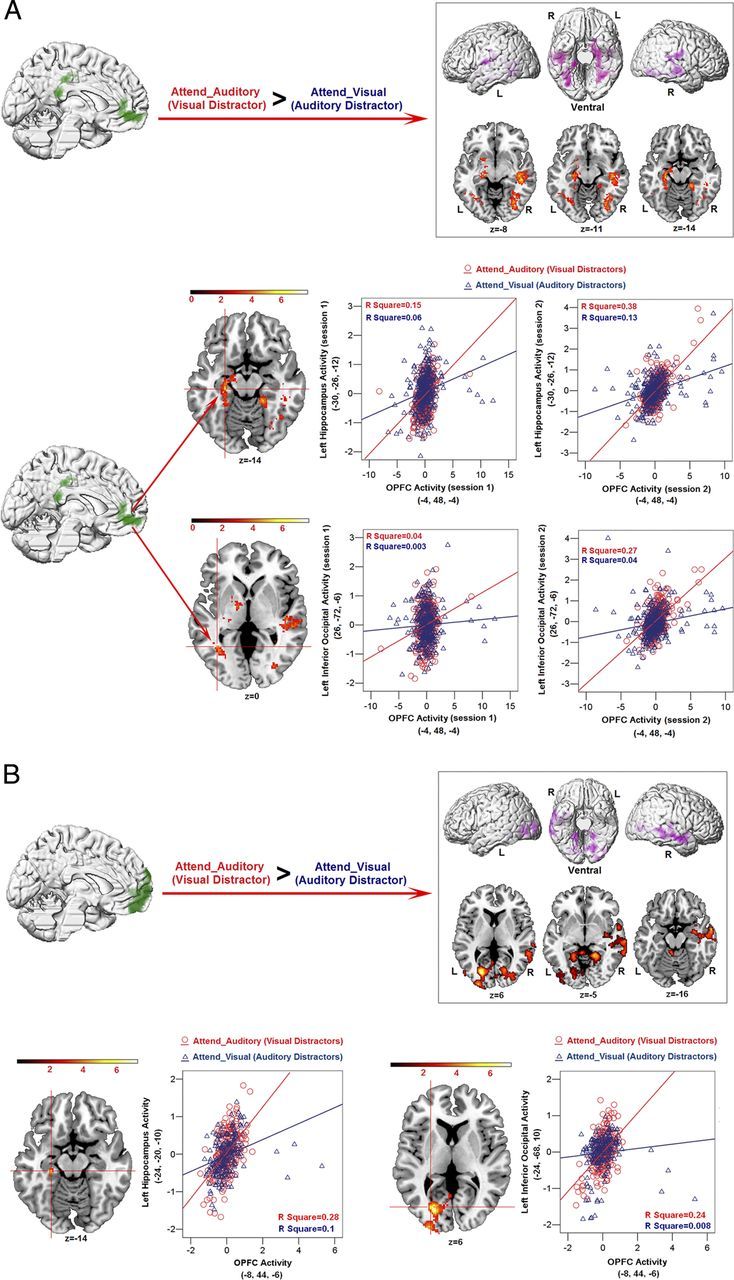
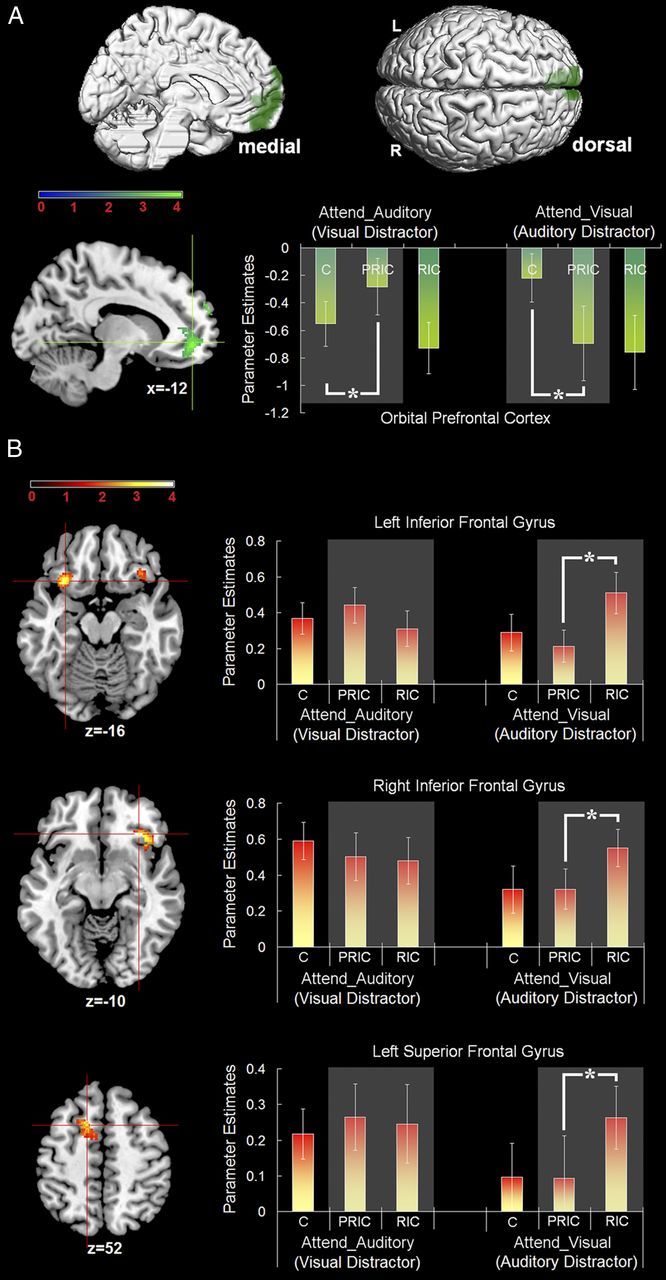
There are ongoing debates on the direction of sensory dominance in cross-modal interaction. In the present study, we demonstrate that the specific direction of sensory dominance depends on the level of processing: vision dominates at earlier stages, whereas audition dominates at later stages of cognitive processing. Moreover, these dominances are subserved by different neural networks. In three experiments, human participants were asked to attend to either visual or auditory modality while ignoring simultaneous stimulus inputs from the other modality. By manipulating three levels of congruency between the simultaneous visual and auditory inputs, congruent (C), incongruent at preresponse level (PRIC), and incongruent at response level (RIC), we differentiated the cross-modal conflict explicitly into preresponse (PRIC > C) and response (RIC > PRIC) levels. Behavioral data in the three experiments consistently suggested that visual distractors caused more interference to auditory processing than vice versa (i.e., the typical visual dominance) at the preresponse level, but auditory distractors caused more interference to visual processing than vice versa (i.e., the typical auditory dominance) at the response level regardless of experimental tasks, types of stimuli, or differential processing speeds in different modalities. Dissociable neural networks were revealed, with the default mode network being involved in the visual dominance at the preresponse level and the prefrontal executive areas being involved in the auditory dominance at the response level. The default mode network may be attracted selectively by irrelevant visual, rather than auditory, information via enhanced neural coupling with the ventral visual stream, resulting in visual dominance at the preresponse level.


Figures

Figure 1.
Figure 1.
A, Design and exemplar stimuli in Experiment 1. Top: Three faces of politicians and three faces of movie stars were used as the visual stimuli and the spoken names of the six persons were used as the auditory stimuli. Bottom: Three levels of congruency were created. In the C condition, the auditory name and the visual face refer to the same person. In the PRIC condition, the auditory and visual stimuli refer to two different persons, either both politicians or both movie stars. In the RIC condition, the auditory and visual stimuli refer to a politician and a movie star or vice versa. B, Design and exemplar stimuli in Experiment 2. Top: Faces of two movie stars and their spoken names served as targets. Another two movie stars and the two target movie stars served as distractors. Examples of the manipulation of the three levels of congruency are given for the situation in which the visual modality was attended. Bottom: Examples of the manipulation of the three levels of congruency are also given for the situation in which the visual modality was attended. C, Design and exemplar stimuli in Experiment 3. Two written color words and their verbal sounds served as targets. Another two color words and the two target color words served as distractors. Examples of the manipulation of the three levels of congruency are also given for the situation in which the visual modality was attended.
Figure 2.
Figure 2.
A, Behavioral results of Experiment 1. Top: Mean RTs are shown as a function of the six experimental conditions. Bottom: Sizes of cross-modal conflict at the preresponse (PRIC > C) and response (RIC > PRIC) levels are shown as a function of the attended modality. B, Behavioral results of Experiment 2. Top: Mean RTs are shown as a function of the six experimental conditions. Bottom: Sizes of cross-modal conflict at the preresponse (PRIC > C) and response (RIC > PRIC) levels are shown as a function of the attended modality. C, Behavioral results of Experiment 3. Top: Mean RTs are shown as a function of the six experimental conditions. Bottom: Sizes of cross-modal conflict at the preresponse (PRIC > C) and response (RIC > PRIC) levels are shown as a function of the attended modality. Conditions denoted by an asterisk indicate a significant difference between them (p < 0.05, Bonferroni corrected).
Figure 3.
Figure 3.
Main effects of cross-modal congruency in Experiment 1 (A) and Experiment 2 (B), collapsing over attended modalities.
Figure 4.
Figure 4.
Neural correlates underlying the visual and auditory dominance at different levels in Experiment 1. A, Visual dominance at the preresponse level. OPFC and PCC were significantly activated by the neural interaction contrast Attend_Auditory (PRIC > C) > Attend_Visual (PRIC > C), inclusively masked by Attend_Auditory (PRIC > C). Mean parameter estimates in the two activated clusters are shown as a function of the six experimental conditions. B, Auditory dominance at the response level. PCG, bilateral IFG, left superior temporal gyrus, and left inferior occipital cortex were significantly activated by the interaction contrast Attend_Visual (RIC > PRIC) > Attend_Auditory (RIC > PRIC), inclusively masked by Attend_Visual (RIC > PRIC). Mean parameter estimates in left IFG and PCG are shown as a function of the six experimental conditions. The pattern of neural activity in other regions was similar to that in the above two regions. The four conditions shaded were the conditions involved in the interaction contrasts. Error bars represent SEs. Conditions denoted by an asterisk indicate a significant difference between them (p < 0.05).
Figure 5.
Figure 5.
PPI analysis based on neural activity in OPFC with the contrast Attend_Auditory > Attend_Visual as the psychological factor. The source region in OPFC is marked in green. A, Experiment 1. Top: Bilateral temporal and occipital cortex extending to bilateral fusiform and bilateral hippocampus showed significant context-dependent covariations with the neural activity in OPFC. The coupling was stronger in the Attend_Auditory condition than in the Attend_Visual condition. To give a clear view of ventral cortical structures, the cerebellum is removed in the display. Bottom: PPI analysis based on the neural activity in OPFC (green) for a representative participant. Mean corrected neural activity in left hippocampus and left inferior occipital cortex is displayed as a function of mean corrected activity in OPFC (i.e., the first principal component from a sphere of 4 mm radius) in the Attend_Auditory blocks (red dots and lines) and the Attend_Visual blocks (blue triangles and lines) for the two sessions, respectively. B, Experiment 2. Top: Bilateral occipital cortex and right middle temporal gyrus extending to right hippocampus showed stronger functional connectivity with OPFC in the Attend_Auditory than in the Attend_Visual blocks. Bottom: For a representative participant, mean corrected neural activity in left hippocampus and left inferior occipital cortex (from the SVC analysis based on the activations in the PPI analysis in Experiment 1) is displayed as a function of mean corrected neural activity in OPFC in the Attend_Auditory blocks compared with the Attend_Visual blocks.
Figure 6.
Figure 6.
Neural correlates underlying the visual and auditory dominance at different levels in Experiment 2. A, Visual dominance at the preresponse level. OPFC was significantly activated in the interaction contrast Attend_Auditory (PRIC > C) > Attend_Visual (PRIC > C), inclusively masked by Attend_Auditory (PRIC > C). Mean parameter estimates in the activated cluster are shown as a function of the six experimental conditions. B, Auditory dominance at the response level. Bilateral IFG and left superior frontal gyrus were significantly activated in the contrast Attend_Visual (RIC > PRIC) > Attend_Auditory (RIC > PRIC), inclusively masked by Attend_Visual (RIC > PRIC). Mean parameter estimates in the three areas are shown as a function of the six experimental conditions. The four conditions shaded are the conditions involved in the interaction contrasts. Error bars represent SEs. Conditions denoted by an asterisk indicate a significant difference between them (p < 0.05).

Similar articles

Cited by

References

    1. Aron AR, Fletcher PC, Bullmore ET, Sahakian BJ, Robbins TW. Stop-signal inhibition disrupted by damage to right inferior frontal gyrus in humans. Nat Neurosci. 2003;6:115–116. doi: 10.1038/nn1003. - DOI - PubMed
    1. Bar M, Tootell RB, Schacter DL, Greve DN, Fischl B, Mendola JD, Rosen BR, Dale AM. Cortical mechanisms specific to explicit visual object recognition. Neuron. 2001;29:529–535. doi: 10.1016/S0896-6273(01)00224-0. - DOI - PubMed
    1. Bar M, Kassam KS, Ghuman AS, Boshyan J, Schmid AM, Dale AM, Hämäläinen MS, Marinkovic K, Schacter DL, Rosen BR, Halgren E. Top-down facilitation of visual recognition. Proc Natl Acad Sci U S A. 2006;103:449–454. doi: 10.1073/pnas.0507062103. - DOI - PMC - PubMed
    1. Barbas H. Organization of cortical afferent input to orbitofrontal areas in the rhesus monkey. Neuroscience. 1993;56:841–864. doi: 10.1016/0306-4522(93)90132-Y. - DOI - PubMed
    1. Bernard FA, Bullmore ET, Graham KS, Thompson SA, Hodges JR, Fletcher PC. The hippocampal region is involved in successful recognition of both remote and recent famous faces. Neuroimage. 2004;22:1704–1714. doi: 10.1016/j.neuroimage.2004.03.036. - DOI - PubMed

Publication types

LinkOut - more resources