. 2013 Apr 24;33(17):7130-44.
doi: 10.1523/JNEUROSCI.3576-12.2013.

Short-term depression of external globus pallidus-subthalamic nucleus synaptic transmission and implications for patterning subthalamic activity

Affiliations

Short-term depression of external globus pallidus-subthalamic nucleus synaptic transmission and implications for patterning subthalamic activity

Jeremy F Atherton et al. J Neurosci. .

Abstract

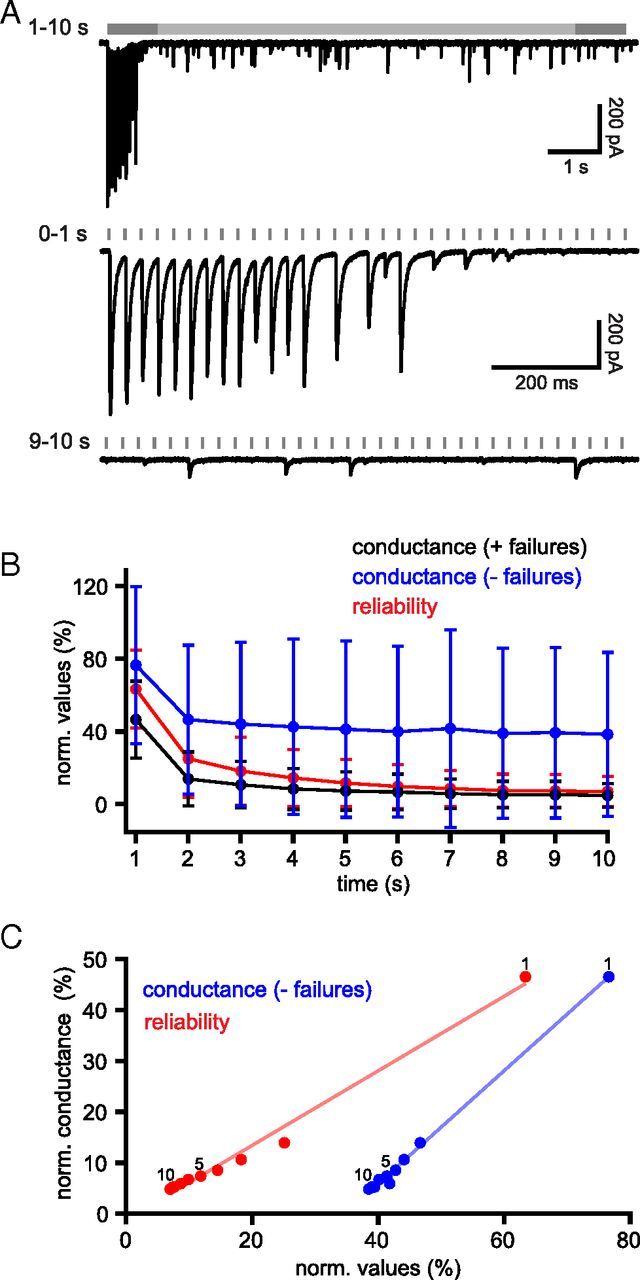
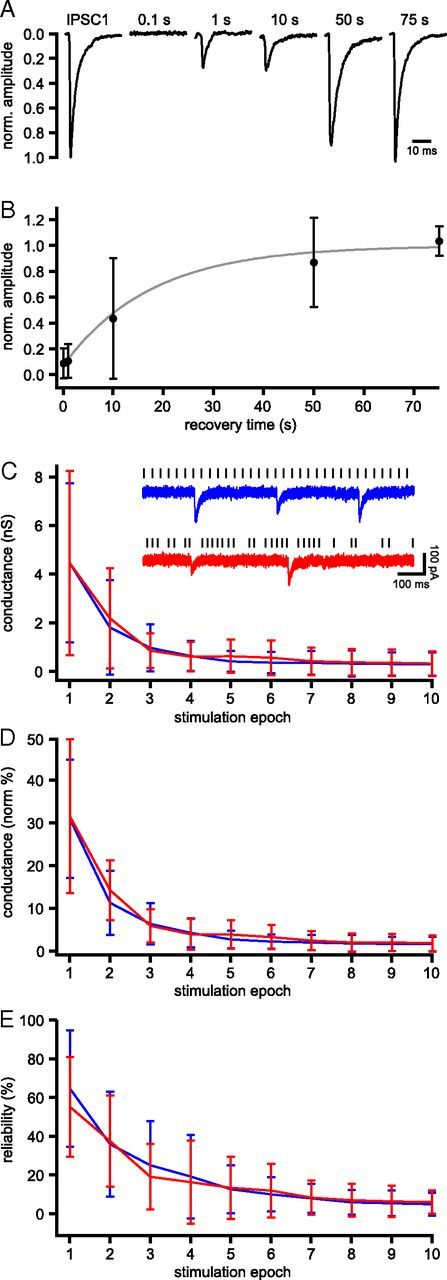
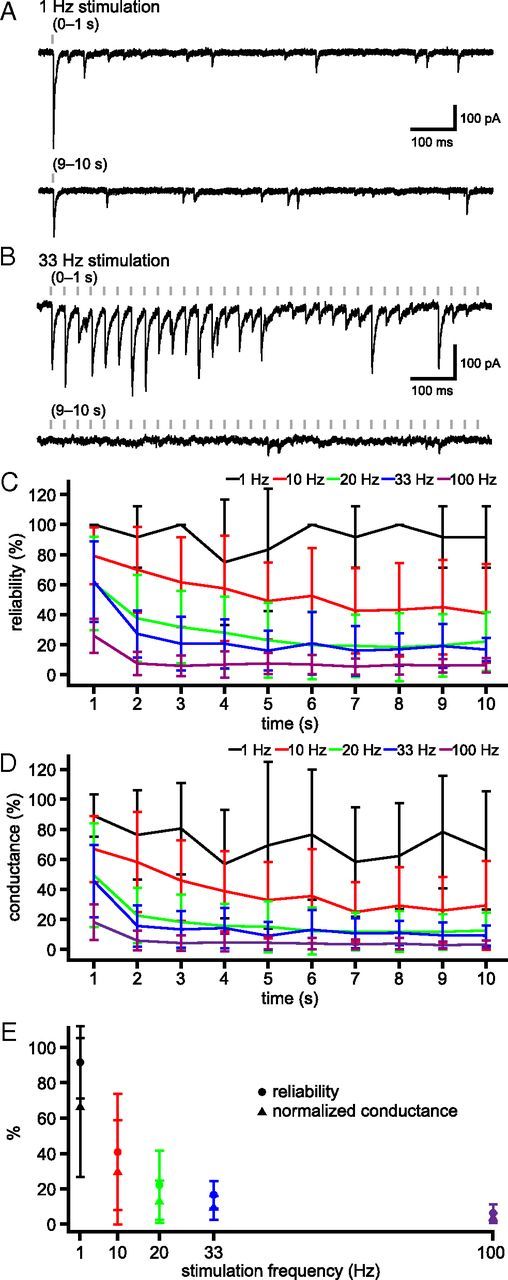
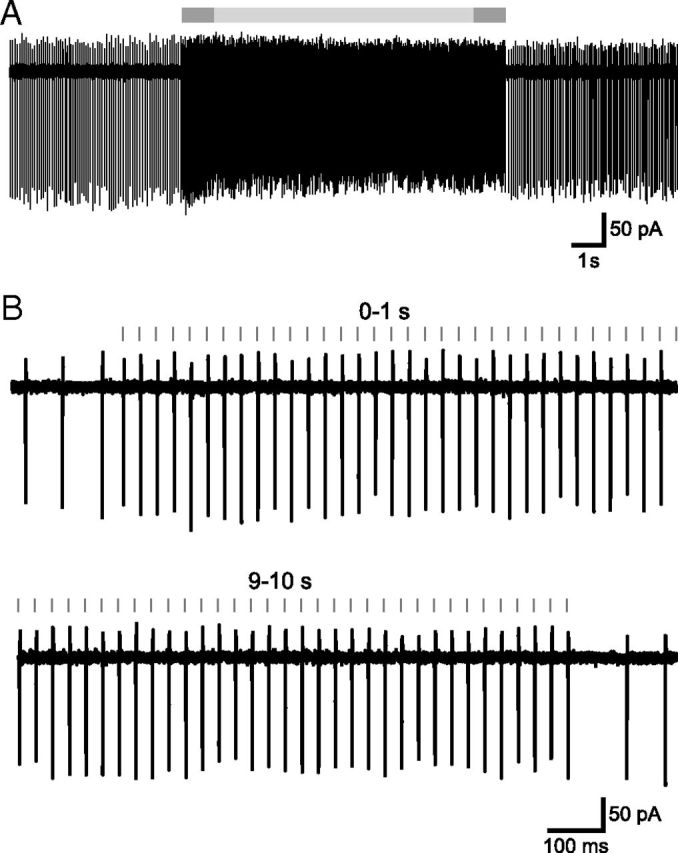
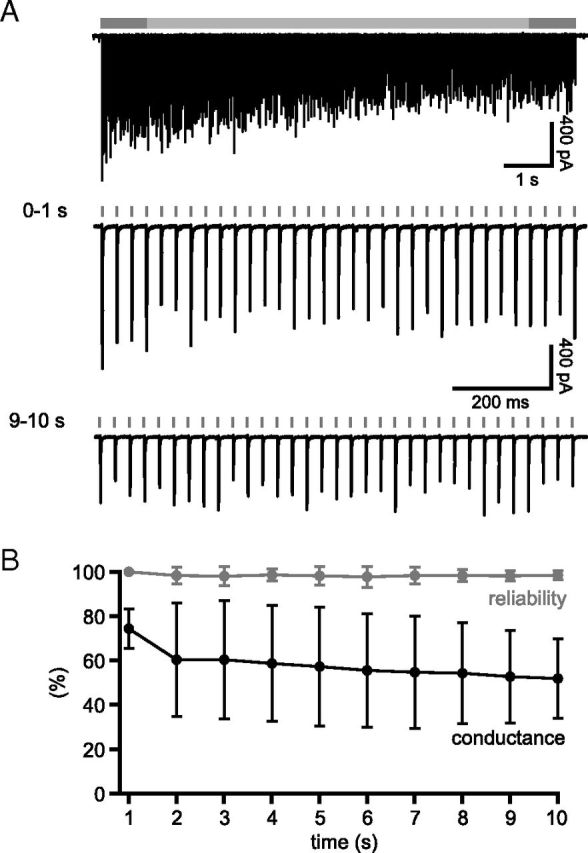
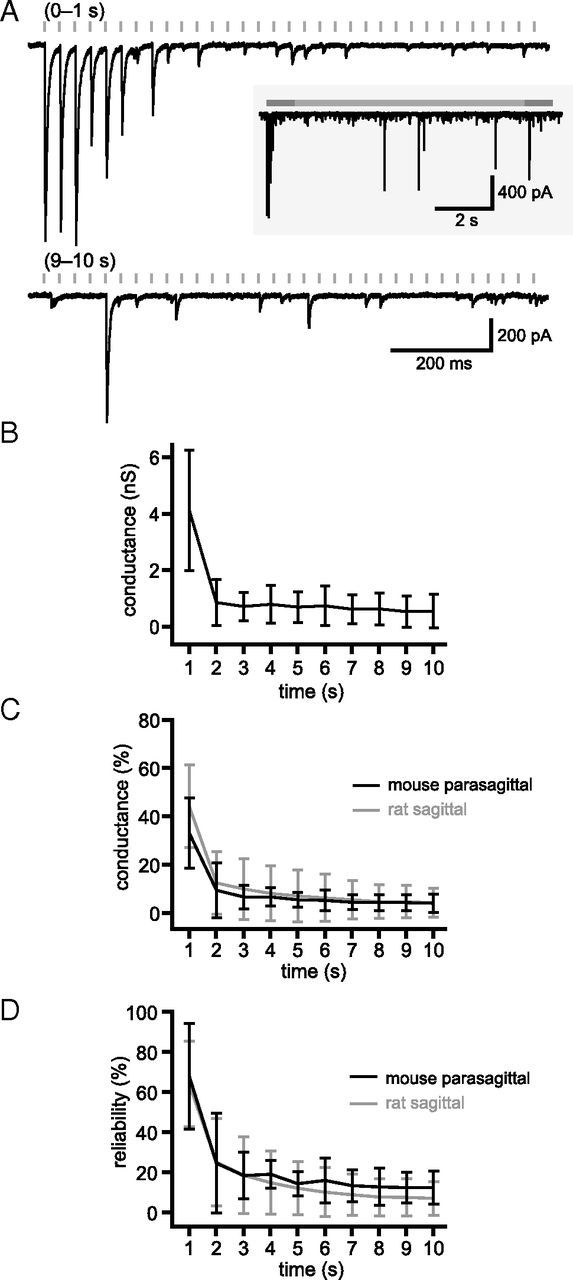
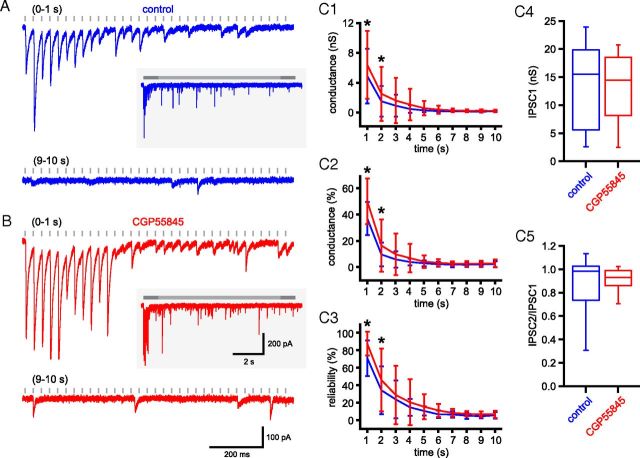
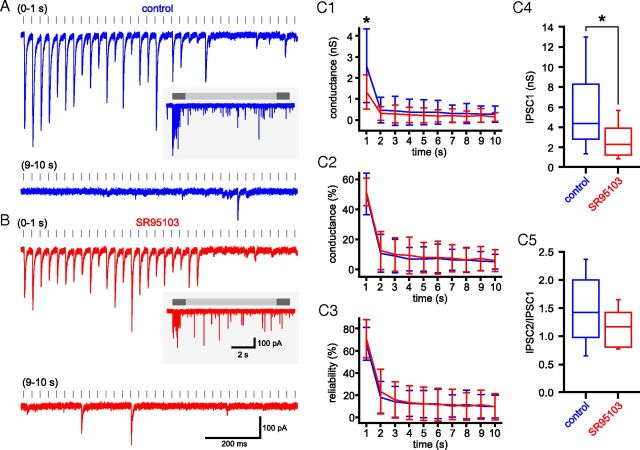
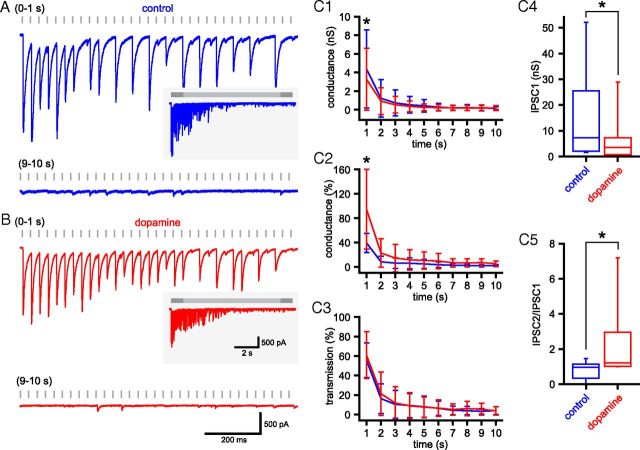
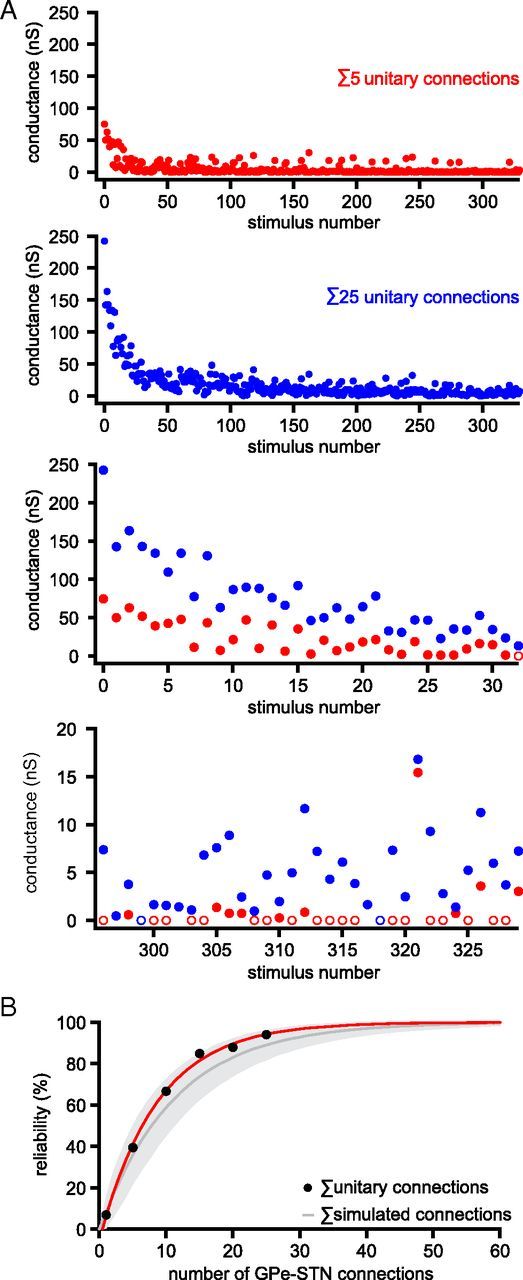
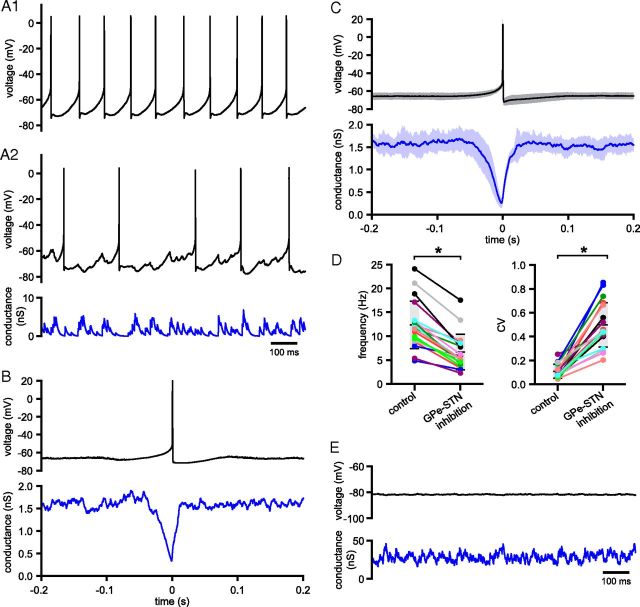
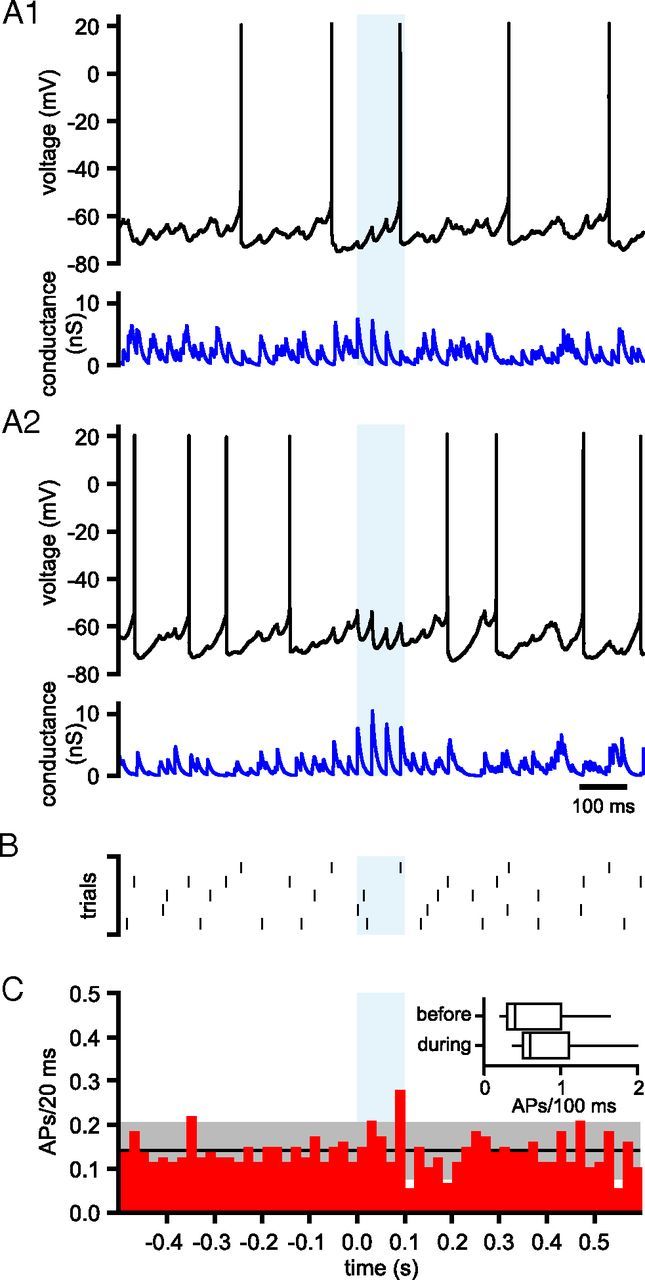
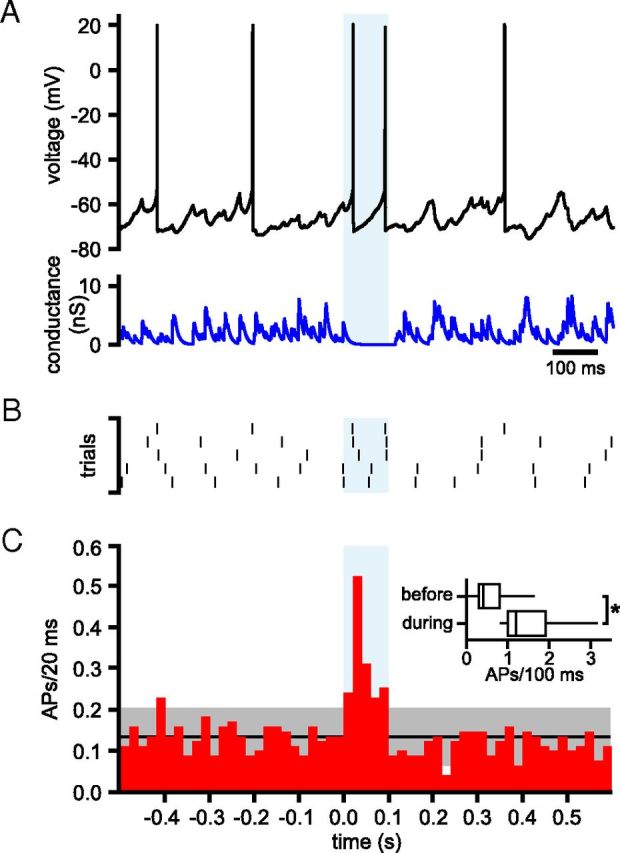
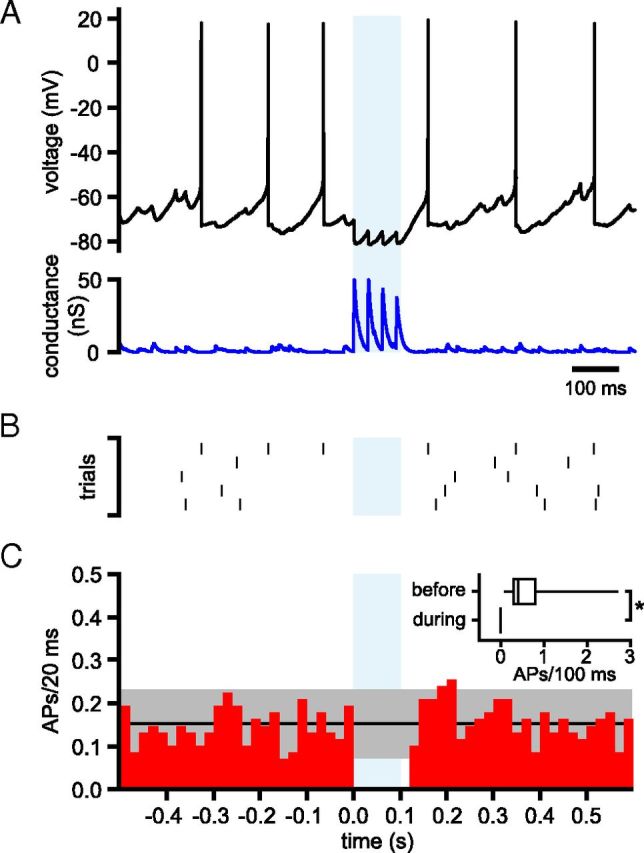
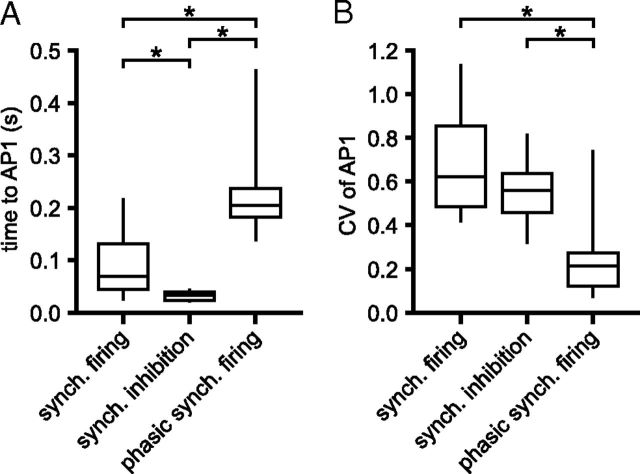
The frequency and pattern of activity in the reciprocally connected GABAergic external globus pallidus (GPe) and glutamatergic subthalamic nucleus (STN) are closely related to motor function. Although phasic, unitary GPe-STN inputs powerfully pattern STN activity ex vivo, correlated GPe-STN activity is not normally observed in vivo. To test the hypothesis that the GPe's influence is constrained by short-term synaptic depression, unitary GPe-STN inputs were stimulated in rat and mouse brain slices at rates and in patterns that mimicked GPe activity in vivo. Together with connectivity estimates these data were then used to simulate GPe-STN transmission. Unitary GPe-STN synaptic connections initially generated large conductances and transmitted reliably. However, the amplitude and reliability of transmission declined rapidly (τ = 0.6 ± 0.5 s) to <10% of their initial values when connections were stimulated at the mean rate of GPe activity in vivo (33 Hz). Recovery from depression (τ = 17.3 ± 18.9 s) was also longer than pauses in tonic GPe activity in vivo. Depression was the result of the limited supply of release-ready vesicles and was in sharp contrast to Calyx of Held transmission, which exhibited 100% reliability. Injection of simulated GPe-STN conductances revealed that synaptic depression caused tonic, nonsynchronized GPe-STN activity to disrupt rather than abolish autonomous STN activity. Furthermore, synchronous inhibition of tonically active GPe-STN neurons or phasic activity of GPe-STN neurons reliably patterned STN activity through disinhibition and inhibition, respectively. Together, these data argue that the frequency and pattern of GPe activity profoundly influence its transmission to the STN.


Figures

Figure 1.
Figure 1.
Unitary GPe–STN synaptic transmission is subject to profound short-term depression at in vivo rates of activity. A, Example of a unitary GPe–STN synaptic connection stimulated at 33 Hz for 10 s. Gray bar (top) represents the duration of stimulation. Dark gray represents the first and 10th seconds of stimulation, shown on an expanded time scale below. The amplitude and reliability of transmission during the first seconds of stimulation were considerably greater than during the 10th second of stimulation. B, C, Population data arising from 29 unitary connections. B, Plots of normalized mean conductance, including transmission failures (black markers), excluding transmission failures (blue markers), and mean reliability (red markers) per second of stimulation at 33 Hz. C, Normalized mean conductance excluding failures (blue markers) and reliability of transmission (red markers) are shown plotted against normalized mean conductance including failures. Points derived from first, fifth and 10th seconds of stimulation are denoted.
Figure 2.
Figure 2.
Unitary GPe–STN synaptic transmission recovers slowly from short-term synaptic depression. A, Example of the first IPSC from a 10 s train of 33 Hz stimulation and responses 0.1, 1, 10, 50, and 75 s after the train of stimulation. B, Mean recovery time course of transmission of the sample population (n = 5). The data were fit to a mono-exponential with τ of 17.3 ± 18.9 s (gray line). C–E, Plots of mean conductance (C), mean normalized conductance (D), and mean reliability (E) of unitary GPe–STN transmission per second of stimulation at 33 Hz in a regular (blue) or irregular in vivo-like (red) pattern (n = 6). C, Inset, Example of steady-state unitary GPe–STN synaptic transmission in response to a regular (blue) or irregular in vivo-like (red) pattern of stimulation.
Figure 3.
Figure 3.
Activity dependence of unitary GPe–STN synaptic transmission. A, B, Example of unitary GPe–STN synaptic transmission during the first and 10th seconds of stimulation at 1 Hz (A) and 33 Hz (B). C, D, Population data (n = 5): mean reliability of transmission (C) and normalized conductance (D) at 1, 10, 20, 33, and 100 Hz stimulation. E, Steady-state reliability of transmission (●) and normalized conductance (▴) plotted against stimulation frequency.
Figure 4.
Figure 4.
GPe–STN synaptic depression is not the result of failure of action potential generation and propagation in GPe axons. A, Action currents in a GPe neuron before, during, and after electrical stimulation of the internal capsule caudal to the GPe at 33 Hz for 10 s. The period of stimulation is indicated with a gray bar and is flanked by periods of autonomous GPe activity. B, The first and 10th seconds of stimulation from the area indicated by the darker gray bars in A. Action currents were generated after each stimulus throughout the stimulation period in this and each GPe neuron tested.
Figure 5.
Figure 5.
Under the same recording conditions, Calyx of Held transmission is reliable. A, Example of unitary synaptic transmission at the Calyx of Held during 10 s of stimulation at 33 Hz. B, Population data (n = 5). Mean normalized conductance (black) and reliability (gray) of transmission against time.
Figure 6.
Figure 6.
GPe–STN synaptic depression is not the result of transection of GPe–STN axons. A, Example of unitary synaptic transmission after stimulation of the GPe in a mouse parasagittal brain slice that preserves GPe–STN connectivity. The first and 10th seconds of stimulation at 33 Hz are shown. Inset, The entire stimulation period. B–D, Population data (n = 5). Mean conductance (B), mean normalized conductance (C), and reliability of transmission (D) against time. C, D, Gray traces represent overlay of unitary rat GPe–STN data for comparison.
Figure 7.
Figure 7.
GPe–STN synaptic depression is not the result of activation of presynaptic GABAB autoreceptors. A, B, Example of unitary GPe–STN synaptic transmission during the first and 10th seconds of stimulation at 33 Hz under control conditions (A) and in the presence of the GABAB receptor antagonist CGP 55845 (B; 2 μm). Inset, The entire stimulation period. C, Population data (n = 8): mean conductance (C1), mean normalized conductance (C2), and reliability of transmission (C3) against time and box plots illustrating amplitude of IPSC1 (C4) and ratio of IPSC2:IPSC1 (C5). Scale bars in B also apply to A. *p < 0.05.
Figure 8.
Figure 8.
GPe–STN synaptic depression is not due to desensitization of postsynaptic GABAA receptors or reduction in the concentration of released GABA. A, B, Example of unitary GPe–STN synaptic transmission during the first and 10th seconds of stimulation at 33 Hz under control conditions (A) and in the presence of the low-affinity GABAA receptor antagonist SR95103 (B; 5 μm). Inset, The entire stimulation period. C, Population data (n = 6): mean conductance (C1), mean normalized conductance (C2), and reliability of transmission (C3) against time and box plots illustrating amplitude of IPSC1 (C4) and ratio of IPSC2:IPSC1 (C5). Scale bars in B also apply to A. *p < 0.05.
Figure 9.
Figure 9.
GPe–STN synaptic depression is not prevented by activation of dopamine receptors. A, B, Example of unitary GPe–STN synaptic transmission during the first and 10th seconds of stimulation at 33 Hz under control conditions (A) and in the presence of dopamine (B; 10 μm). Inset, The entire stimulation period. C, Population data (n = 10): mean conductance (C1), mean normalized conductance (C2), and reliability of transmission (C3) against time and box plots illustrating amplitude of IPSC1 (C4) and ratio of IPSC2:IPSC1 (C5). Scale bars in B also apply to A. *p < 0.05.
Figure 10.
Figure 10.
Synchronous activity of multiple unitary GPe–STN synaptic connections increases the reliability of GPe–STN transmission. A, Comparison of GPe–STN transmission arising from the addition of 5 (red dots) and 25 (blue dots) unitary inputs randomly selected from a sample of 27 recorded unitary GPe–STN connections stimulated at 33 Hz for 10 s. Open circles represent failures of transmission. Lower two panels, First and 10th seconds of stimulation. B, Plot of number of randomly selected (black dots; red line indicates monoexponential fit) and simulated (gray represents mean ± SD. of 1000 simulations) unitary GPe–STN connections versus the reliability of steady-state GPe–STN transmission at 33 Hz.
Figure 11.
Figure 11.
Tonic, irregular, asynchronous GPe–STN activity disrupts, but does not prevent, autonomous STN activity. Activity of a STN neuron (black) in the absence (A1) and presence of simulated GABAA receptor-mediated inhibition arising from 60 GPe–STN neurons discharging at 33 Hz in a nonsynchronous, irregular pattern (A2). The applied inhibitory conductance waveform is illustrated (blue). B, Spike-triggered average of action potentials (black) and the applied inhibitory conductance waveform (blue) from the example in A. C, Population data showing the mean ± SD (shaded area) spike-triggered average for all neurons tested. D, Population data illustrating the frequency and CV of firing in the absence and presence of simulated GPe–STN transmission. Data from individual STN neurons (colored lines and points) and the population means and SDs (horizontal black lines/gray boxes) are illustrated. E, Impact on the activity of a STN neuron (black) of simulated GPe–STN transmission arising from 60 GPe–STN neurons discharging at 33 Hz in a nonsynchronous, irregular pattern that was depressed in amplitude to the same level as in A2 but was 100% reliable (blue). *p < 0.05.
Figure 12.
Figure 12.
Effects of synchronized 33 Hz firing of GPe–STN neurons on STN activity. A, Activity of a STN neuron (black) in the presence of simulated GABAA receptor-mediated inhibition (blue) arising from 60 GPe–STN neurons discharging at 33 Hz in a nonsynchronous, irregular pattern that was interrupted for 100 ms by synchronous, rhythmic firing at 33 Hz (light blue shaded area). A1, A2, Two trials are illustrated; blue represents the respective conductance waveforms for each trial. B, Raster plot of action potentials from 5 trials taken from the neuron shown in A. C, Population PSTH showing action potentials (APs)/20 ms before, during, and after 100 ms of synchronous 33 Hz firing. The black line and gray shaded area show the mean ± 2 SD of firing during nonsynchronous input. Inset, Box plots comparing action potentials in the 100 ms before and during synchronization of GPe–STN activity/transmission. *p < 0.05.
Figure 13.
Figure 13.
Effects of synchronous inhibition of GPe–STN activity on STN firing. A, Activity of a STN neuron (black) in the presence of simulated GABAA receptor-mediated inhibition (blue) arising from 60 GPe–STN neurons discharging at 33 Hz in a nonsynchronous, irregular pattern that was interrupted for 100 ms by synchronous inhibition of GPe–STN activity (light blue shaded area). B, Raster plot showing the times of action potentials in 5 trials from the STN neuron shown in A. C, Population PSTH showing action potentials (APs)/20 ms before, during, and after 100 ms of synchronous inhibition of GPe–STN activity. The black line and gray shaded area show the mean ± 2 SD of firing during nonsynchronous activity. Inset, Box plots comparing the number of action potentials in the 100 ms before and during synchronous inhibition of GPe–STN activity/transmission. *p < 0.05.
Figure 14.
Figure 14.
Effects of synchronized phasic 33 Hz firing of 10% of GPe–STN neurons on STN activity. A, Activity of a STN neuron (black) in the presence of simulated GABAA receptor-mediated inhibition (blue) arising from 54 GPe–STN neurons discharging at 33 Hz in a nonsynchronous, irregular pattern and from 6 GPe–STN neurons that discharged synchronously for 100 ms at 33 Hz but were otherwise inactive (light blue shaded area). B, Raster plot showing the times of action potentials in 5 trials from the STN neuron shown in A. C, Population PSTH showing action potentials (APs)/20 ms before, during, and after partial, phasic, synchronous GPe–STN activity. The black line and gray shaded area show the mean ± 2 SD of firing during nonsynchronous input. Inset, Box plots comparing action potentials 100 ms before and during 100 ms partial, phasic, synchronous GPe–STN activity/transmission. *p < 0.05.
Figure 15.
Figure 15.
STN output in response to patterns of synthetic GPe–STN inhibition. Box plots summarizing the latency (A) and CV of latency (B) to the first action potential (AP1) following the onset of 100 ms synchronous (synch.) GPe–STN firing or 100 ms of synchronous inhibition of GPe–STN activity or 100 ms of partial, phasic, synchronous GPe–STN firing. *p < 0.05.

References

    1. Abbott LF, Regehr WG. Synaptic computation. Nature. 2004;431:796–803. doi: 10.1038/nature03010. - DOI - PubMed
    1. Atherton JF, Kitano K, Baufreton J, Fan K, Wokosin D, Tkatch T, Shigemoto R, Surmeier DJ, Bevan MD. Selective participation of somatodendritic HCN channels in inhibitory but not excitatory synaptic integration in neurons of the subthalamic nucleus. J Neurosci. 2010;30:16025–16040. doi: 10.1523/JNEUROSCI.3898-10.2010. - DOI - PMC - PubMed
    1. Bar-Gad I, Heimer G, Ritov Y, Bergman H. Functional correlations between neighboring neurons in the primate globus pallidus are weak or nonexistent. J Neurosci. 2003;23:4012–4016. - PMC - PubMed
    1. Barry PH. JPCalc, a software package for calculating liquid junction potential corrections in patch-clamp, intracellular, epithelial and bilayer measurements and for correcting junction potential measurements. J Neurosci Methods. 1994;51:107–116. doi: 10.1016/0165-0270(94)90031-0. - DOI - PubMed
    1. Baufreton J, Bevan MD. D2-like dopamine receptor-mediated modulation of activity-dependent plasticity at GABAergic synapses in the subthalamic nucleus. J Physiol. 2008;586:2121–2142. doi: 10.1113/jphysiol.2008.151118. - DOI - PMC - PubMed

Publication types

LinkOut - more resources