. 2013 Apr 24;33(17):7393-406.
doi: 10.1523/JNEUROSCI.2137-12.2013.

Multiple sources of striatal inhibition are differentially affected in Huntington's disease mouse models

Affiliations

Multiple sources of striatal inhibition are differentially affected in Huntington's disease mouse models

Carlos Cepeda et al. J Neurosci. .

Abstract

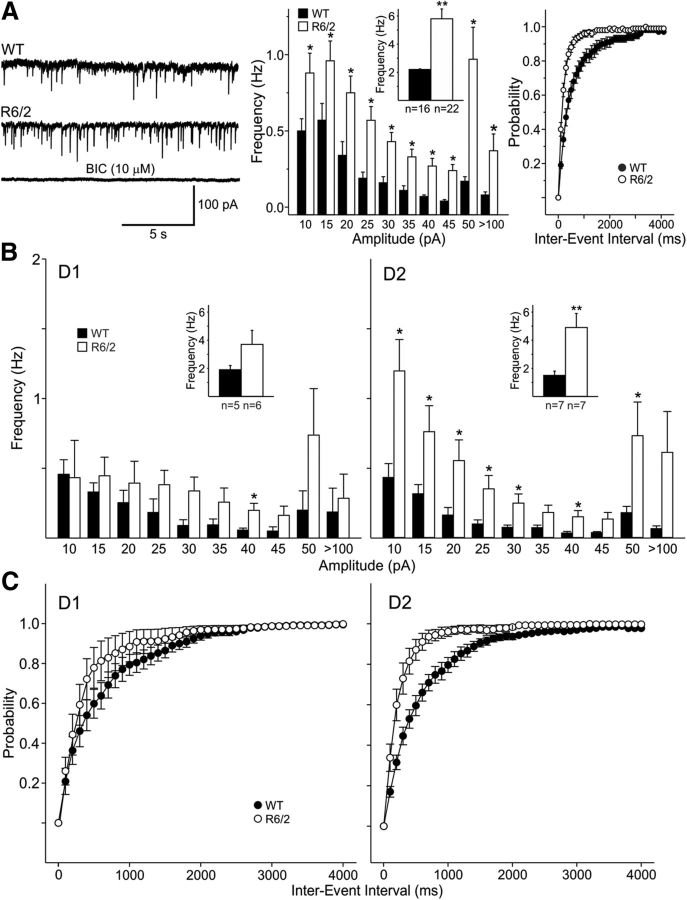
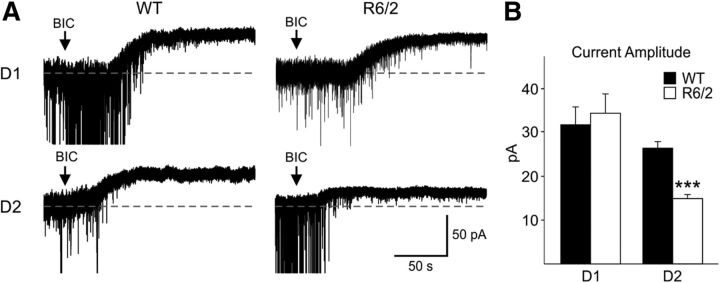
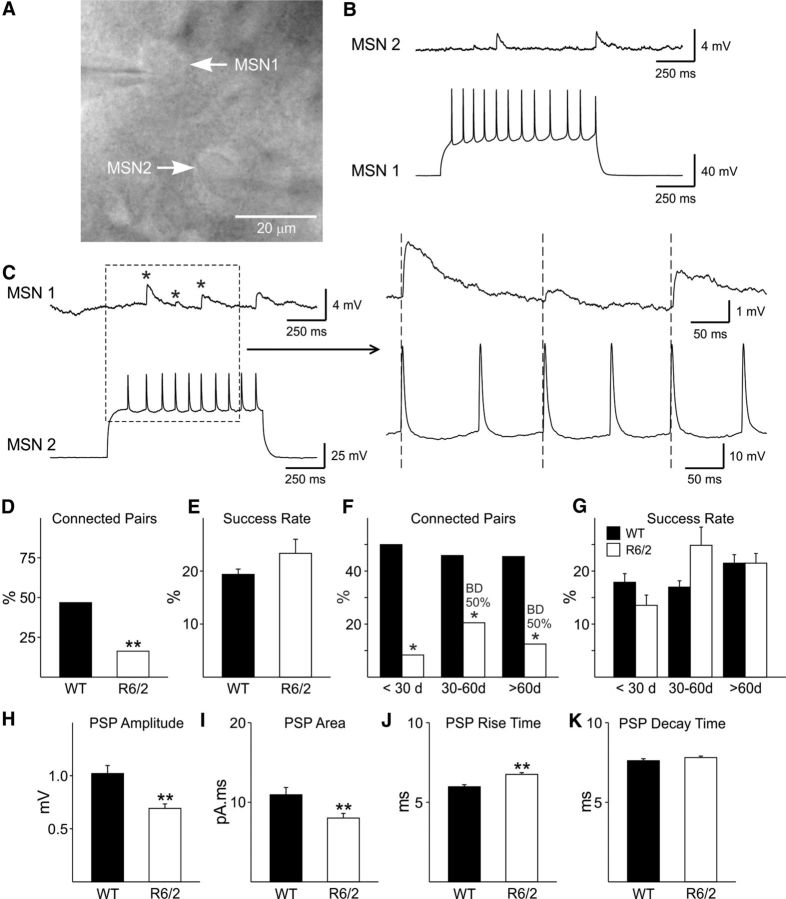
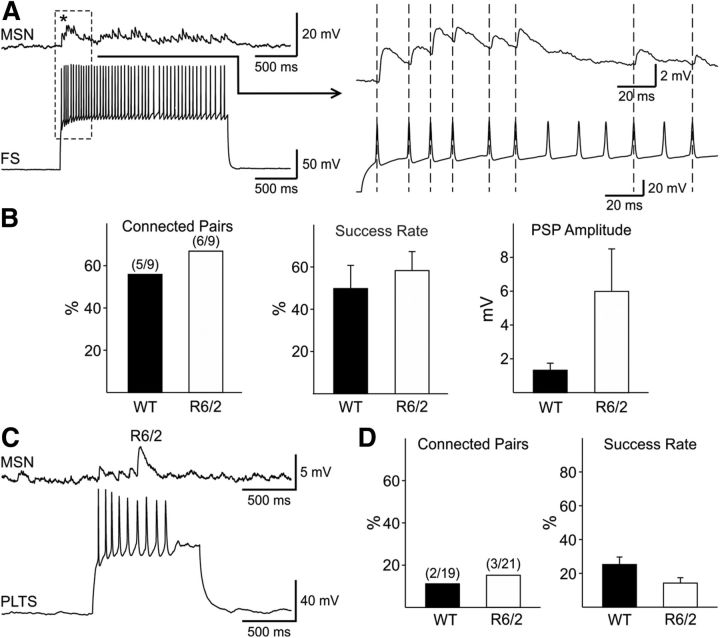
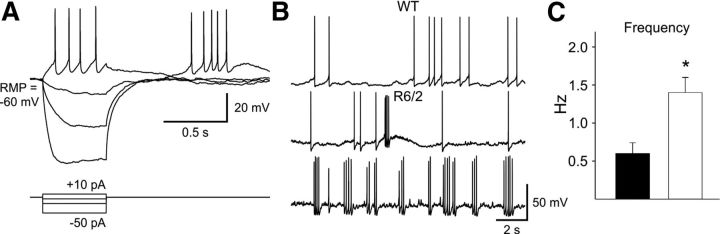
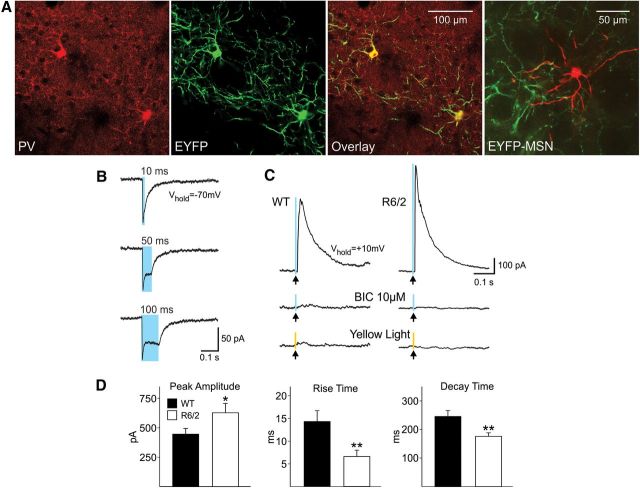
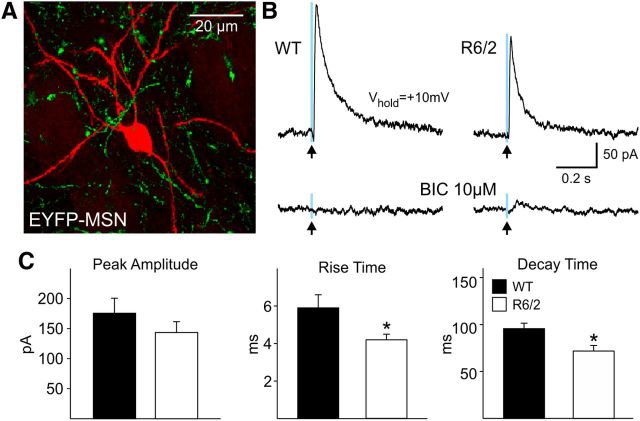
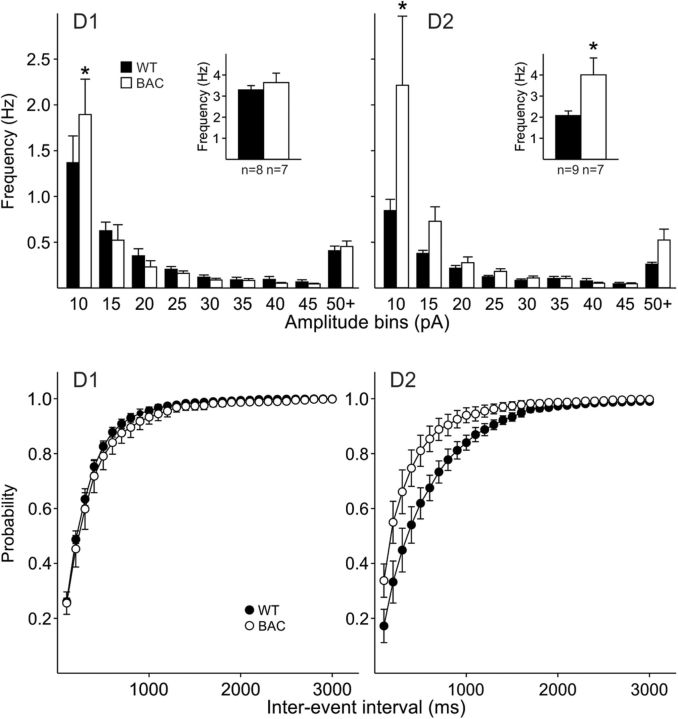
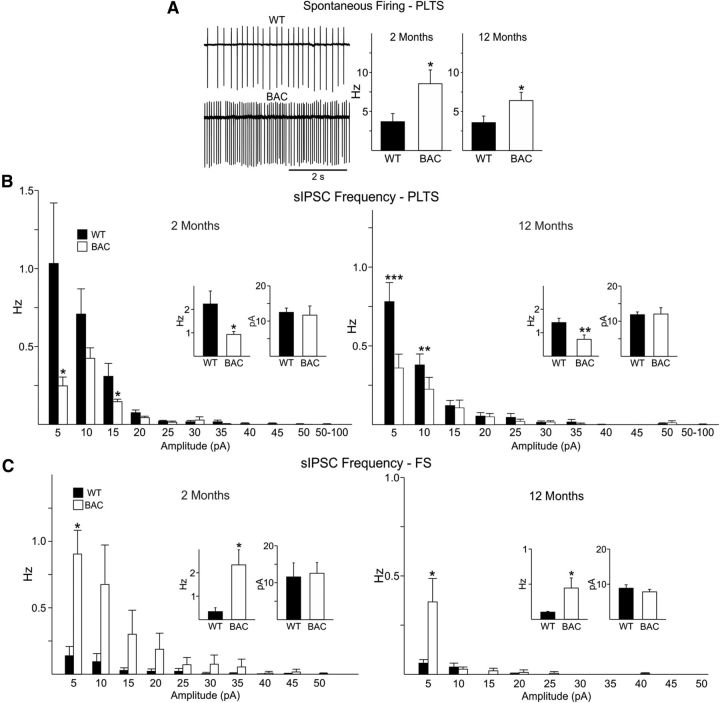
In Huntington's disease (HD) mouse models, spontaneous inhibitory synaptic activity is enhanced in a subpopulation of medium-sized spiny neurons (MSNs), which could dampen striatal output. We examined the potential source(s) of increased inhibition using electrophysiological and optogenetic methods to assess feedback and feedforward inhibition in two transgenic mouse models of HD. Single whole-cell patch-clamp recordings demonstrated that increased GABA synaptic activity impinges principally on indirect pathway MSNs. Dual patch recordings between MSNs demonstrated reduced connectivity between MSNs in HD mice. However, while connectivity was strictly unidirectional in controls, in HD mice bidirectional connectivity occurred. Other sources of increased GABA activity in MSNs also were identified. Dual patch recordings from fast spiking (FS) interneuron-MSN pairs demonstrated greater but variable amplitude responses in MSNs. In agreement, selective optogenetic stimulation of parvalbumin-expressing, FS interneurons induced significantly larger amplitude MSN responses in HD compared with control mice. While there were no differences in responses of MSNs evoked by activating single persistent low-threshold spiking (PLTS) interneurons in recorded pairs, these interneurons fired more action potentials in both HD models, providing another source for increased frequency of spontaneous GABA synaptic activity in MSNs. Selective optogenetic stimulation of somatostatin-expressing, PLTS interneurons did not reveal any significant differences in responses of MSNs in HD mice. These findings provide strong evidence that both feedforward and to a lesser extent feedback inhibition to MSNs in HD can potentially be sources for the increased GABA synaptic activity of indirect pathway MSNs.


Figures

Figure 1.
Figure 1.
A, Traces show sIPSCs from WT and R6/2 MSNs (CsCl internal solution, −70 mV holding potential, CNQX, and AP-5 present). Bottom trace shows that BIC (10 μm) blocked the inward currents demonstrating they were mediated by activation of GABAA receptors. The middle graph shows that amplitude-frequency histograms had significantly increased frequencies of events across all amplitude bins, with the largest increase in the 50–100 pA bin. Inset shows mean frequencies. Right graphs show cumulative interevent interval probability distributions indicating that there was a significant leftward shift in interevent intervals in MSNs from R6/2 mice (proportionately more events with shorter intervals in MSNs) (p < 0.001, K–S test). B, Amplitude-frequency histograms indicate that, although there was a trend, D1-MSNs did not show significantly different frequencies of events in R6/2 mice, except for the 40 pA amplitude bin. In contrast, D2-MSNs in R6/2 mice showed significant increases at all amplitude bins except the largest amplitude bin. C, The cumulative interevent interval probability distributions indicated that there was a significant difference in interevent intervals in D1 (p < 0.05, K–S test) and particularly in D2 MSNs from R6/2 mice (p < 0.001, K–S test). In this and subsequent figures *p < 0.05, **p < 0.01, and ***p < 0.001.
Figure 2.
Figure 2.
A, Examples of traces showing the amplitudes of tonic GABA currents in D1- and D2-expressing MSNs from WT and R6/2 mice. Recordings were in the presence of CNQX (10 μm), AP-5 (50 μm), and CGP (1 μm). The arrow in each trace represents the time when BIC (20 μm) was added. B, Tonic GABA current amplitudes were significantly reduced only in D2 receptor-expressing MSNs from R6/2 mice.
Figure 3.
Figure 3.
A, Examples of IPSCs from MSNs (CsCl internal solution containing 4 mm QX-314) evoked by intrastriatal stimulation in the presence of CNQX and AP-5. Stimulation evoked larger responses in R6/2 mice. These responses were completely blocked by BIC (20 μm) demonstrating they were mediated by activation of GABAA receptors. Graph shows the input–output function between stimulus intensity and evoked peak IPSC amplitude in WT and R6/2 mice. At 0.004, 0.008–0.012 mA, responses were significantly larger in MSNs from R6/2 compared with WT MSNs. B, Kinetics of evoked GABAergic responses indicated that responses of MSNs from R6/2 mice had significantly faster decay times and half-widths. C, Typical PPRs at 25 and 200 ms interpulse intervals in MSNs from WT and R6/2 mice. Graph shows PPRs for intervals 25–800 ms in the two groups. Decreased paired-pulse facilitation in R6/2 MSNs, indicative of greater probability of neurotransmitter release, was significant at the 25 and 50 ms intervals.
Figure 4.
Figure 4.
A, IR-DIC image of two MSNs (from an R6/2 mouse) that were bidirectionally connected. B, Depolarization-induced action potentials in MSN 1 evoked time-locked PSPs in MSN 2. C, Depolarization-induced action potentials in MSN 2 evoked PSPs in MSN 1. Traces on the right are the enlarged area in the dashed box. Asterisks show the three evoked PSPs. D, There was a reduced proportion of connected pairs in R6/2 MSNs compared with WTs (31/66 vs 11/67 in WT vs R6/2; χ2 test, p < 0.001). E, Success rates, although slightly increased in R6/2 MSNs compared with those from WTs, were not significantly different. F, At each age there was a significant decrease in the proportion of connected pairs in MSNs from R6/2s compared with WTs. BD indicates that bidirectional connected pairs were present 50% of the time in MSNs, but only in R6/2 mice. G, Success rates were similar in MSNs from WT and R6/2 mice at the <30 and >60 d groups but were increased in MSNs from R6/2 mice between 30 and 60 d. These differences were not statistically significant. H–K, The PSP amplitudes and areas were significantly smaller in MSNs from R6/2 mice. PSP rise time was significantly slower and decay times were similar.
Figure 5.
Figure 5.
A, Example of a D1–D2 connected pair from a WT mouse. Left, IR-DIC image. Right, Fluorescent image. Only the circled cell on the bottom displays fluorescence. B, Example of a connection between two D1-MSNs from an R6/2 mouse. Traces on the right are the enlarged area in the box. C, In MSN connected pairs (10/24) from WT mice, only unidirectional connectivity occurred. Forty percent (4/10) were D1–D1 and 20% (2/10) were D2–D2 connections. Mixed D1–D2 pairs were connected 40% (4/10) of the time. In MSN connected pairs (7/24) from R6/2 mice, two displayed bidirectional connectivity (counted as two connections, D1 to D1, D1 to D2). The great proportion of connected pairs was between D1–D1 MSNs (6/7). No connected D2–D2 pairs were observed. There also were fewer connected mixed pairs in R6/2 mice when compared with WTs. D, Success rates for D1–D1 connections were slightly higher for R6/2 than WT MSNs. The success rates for R6/2 pairs for D1–D2 and D2–D1 connections were based on one pair in each group and there was no SE.
Figure 6.
Figure 6.
A, Example of depolarization evoked action potentials in an FS interneuron inducing PSPs in an MSN. The enlargement of the dashed box on the right shows summation of PSPs in the MSN. B, FS-to-MSN connectivity was slightly increased in pairs from R6/2 compared with WT mice. Middle and right graphs show that there was no significant difference in the success rates between pairs from WT and R6/2 mice, but there was a trend for PSP amplitudes to be larger and more variable in MSNs from R6/2 mice. C, The traces show dual recordings between a PLTS–MSN pair in an R6/2 mouse. D, There were no significant differences in the connectivity or success rate between PLTS–MSN pairs from WT and R6/2 mice.
Figure 7.
Figure 7.
A, Traces showing a PLTS interneuron from a WT mouse identified electrophysiologically by a depolarized RMP and time-dependent “sag” upon hyperpolarization, as well as the presence of plateau depolarizations and rebound excitation. B, Traces of spontaneous action potentials recorded in current-clamp mode from WT and R6/2 PLTS interneurons. Note the increased spontaneous firing and bursting in the PLTS neurons from R6/2 mice. C, Bar graph shows that there was a significantly higher frequency of spontaneous firing in PLTS interneurons from R6/2 compared with WT mice.
Figure 8.
Figure 8.
A, The expression of PV was visualized by colocalization of immunostaining for PV (red) and expression of EYFP fluorescence of ChR2-PV (green) to demonstrate the construct was only expressed in PV interneurons (yellow). The last panel shows a biocytin-filled MSN (red) surrounded by EYFP expression (green) in axons from PV interneurons. B, Inward currents evoked by blue light (0.5 ms duration, 8 mW power) in a PV-positive interneuron. Note that increasing the duration of the light increases the duration of the current. C, Outward currents evoked from MSNs in WT and R6/2 mice in response to blue light stimulation (0.5 ms duration, 8 mW power) at a holding potential of +10 mV. These currents were blocked by BIC (10 μm) and were not evoked by yellow light (0.5 ms duration light pulse, 2mW). D, Bar graphs show significantly increased mean peak amplitude (p < 0.05) and faster rise (p < 0.01) and decay times (p < 0.01) in MSNs from R6/2 compared with those from WT mice.
Figure 9.
Figure 9.
A. Biocytin-filled MSN (red) and the EYFP expression (green) in axons from SOM interneurons. B, Outward currents evoked in an MSN from a WT and an R6/2 mouse in response to blue light stimulation (0.5 ms duration, 8 mW power) at a holding potential of +10 mV. These currents were blocked by BIC (10 μm) and were not evoked by yellow light (data not shown). C, Bar graphs show that mean peak amplitudes were similar but there were faster rise (p < 0.05) and decay times (p < 0.05) in MSNs from R6/2 compared with those from WT mice.
Figure 10.
Figure 10.
Amplitude-frequency histograms of sIPSCs in MSNs from 12 month BACHD and WT mice indicate that D1-MSNs did not show significantly different frequencies of events compared with WTs (top, left). Inset shows mean frequencies. In contrast, D2-MSNs in BACHD mice showed a significant increase in the frequency of sIPSCs in the 5–10 pA bin and the mean frequencies were significantly increased (inset) (top, right). Bottom graphs show the cumulative interevent interval probability distributions. There were no differences in the interevent interval histograms for the D1 receptor-expressing MSNs. There was a significant difference in the interevent interval histograms from D2 MSNs from BACHD mice (p < 0.05, K–S test).
Figure 11.
Figure 11.
A, Traces showing spontaneous firing in the cell-attached mode from WT and BACHD PLTS cells from the 2 month age group. Right bar graphs show that spontaneous action potential firing in PLTS interneurons from BACHD mice was significantly increased when compared with those of WTs at both ages (p < 0.05, t test for comparisons at 2 months, Mann–Whitney U test for comparison at 12 months). B, Amplitude-frequency histograms of sIPSCs from PLTS interneurons from WT and BACHD mice at 2 and 12 months (insets are averages). There was a significant reduction in mean frequency of sIPSCs in BACHD PLTS neurons, mainly in the small amplitude events, compared with those of WTs at both 2 and 12 months but no difference in mean sIPSC amplitudes. C, Amplitude-frequency histograms of sIPSCs from FS interneurons from WT and BACHD mice at 2 and 12 months (insets are averages). There was a significant increase in the mean frequency of sIPSCs in BACHD FS neurons, mainly in the small amplitude events, compared with those of WTs at both 2 and 12 months but no difference in mean sIPSC amplitudes.

Similar articles

Cited by

References

    1. Albin RL, Reiner A, Anderson KD, Dure LS, 4th, Handelin B, Balfour R, Whetsell WO, Jr, Penney JB, Young AB. Preferential loss of striato-external pallidal projection neurons in presymptomatic Huntington's disease. Ann Neurol. 1992;31:425–430. doi: 10.1002/ana.410310412. - DOI - PubMed
    1. André VM, Fisher YE, Levine MS. Altered balance of activity in the striatal direct and indirect pathways in mouse models of Huntington's disease. Front Syst Neurosci. 2011a;5:46. - PMC - PubMed
    1. André VM, Cepeda C, Fisher YE, Huynh M, Bardakjian N, Singh S, Yang XW, Levine MS. Differential electrophysiological changes in striatal output neurons in Huntington's disease. J Neurosci. 2011b;31:1170–1182. doi: 10.1523/JNEUROSCI.3539-10.2011. - DOI - PMC - PubMed
    1. Bazzett T, Geiger A, Coppola B, Albin R. The neuronal NOS inhibitor L-MIN, but not 7-NINA, reduces neurotoxic effects of chronic intrastriatal administration of quinolinic acid. Brain Res. 1997;775:229–232. doi: 10.1016/S0006-8993(97)00962-1. - DOI - PubMed
    1. Brickley SG, Mody I. Extrasynaptic GABA(A) receptors: their function in the CNS and implications for disease. Neuron. 2012;73:23–34. doi: 10.1016/j.neuron.2011.12.012. - DOI - PMC - PubMed

Publication types