. 2013 Jun 1;190(11):5526-33.
doi: 10.4049/jimmunol.1201885. Epub 2013 Apr 24.

Galectin 1 modulates plasma cell homeostasis and regulates the humoral immune response

Affiliations

Galectin 1 modulates plasma cell homeostasis and regulates the humoral immune response

Adrienne Anginot et al. J Immunol. .

Abstract

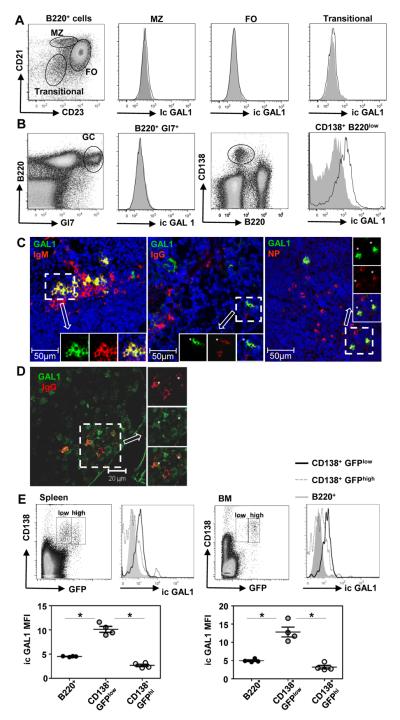
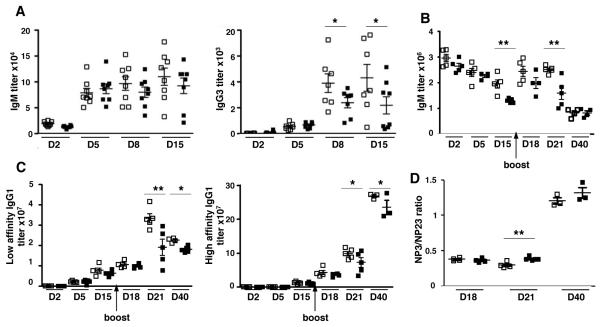
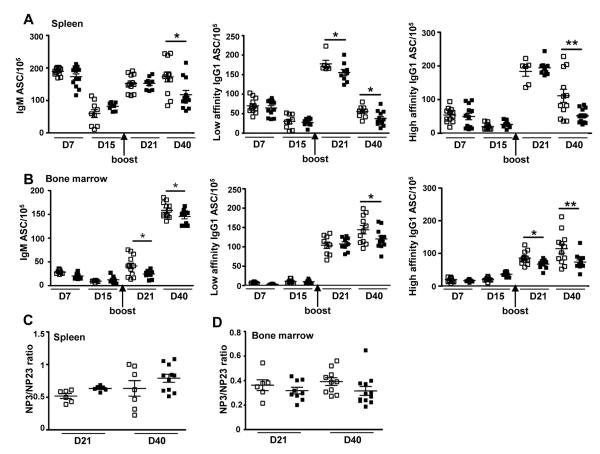
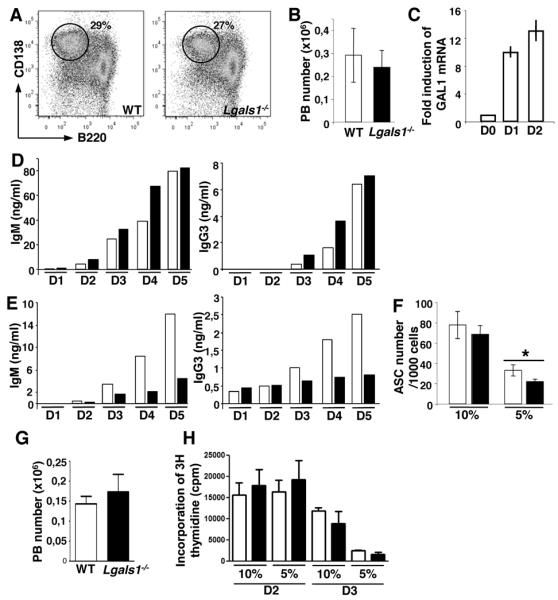
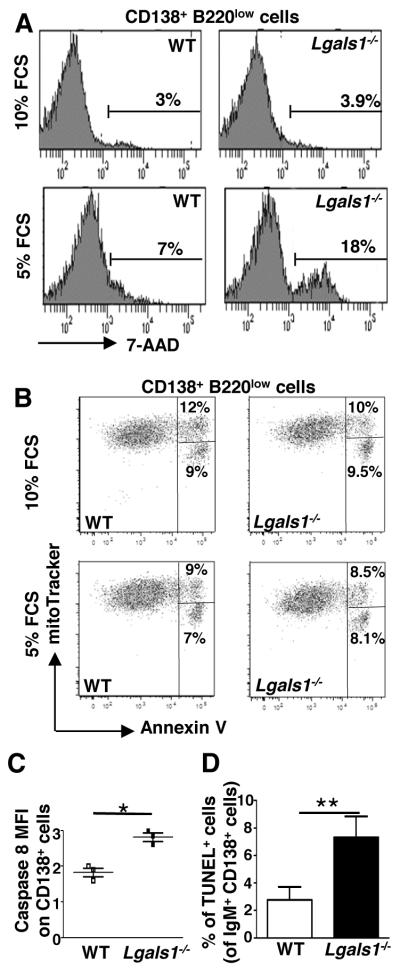
Galectin-1 (GAL1) is an S-type lectin with multiple functions, including the control of B cell homeostasis. GAL1 expression was reported to be under the control of the plasma cell master regulator BLIMP-1. GAL1 was detected at the protein level in LPS-stimulated B cells and was shown to promote Ig secretion in vitro. However, the pattern of GAL1 expression and function of GAL1 in B cells in vivo are still unclear. In this study, we show that, among B cells, GAL1 is only expressed by differentiating plasma cells following T-dependent or T-independent immunization. Using GAL1-deficient mice we demonstrate that GAL1 expression is required for the maintenance of Ag-specific Ig titers and Ab-secreting cell numbers. Using an in vitro differentiation assay we find that GAL1-deficient plasmablasts can develop normally but die rapidly, through caspase 8 activation, under serum starvation-induced death conditions. TUNEL assays show that in vivo-generated GAL1-deficient plasma cells exhibit an increased sensitivity to apoptosis. Taken together, our data indicate that endogenous GAL1 supports plasma cell survival and participates in the regulation of the humoral immune response.


Figures

Figure 1
Figure 1. GAL1 is expressed by plasmablasts
Spleen cells from non-immunized mice (A) and mice immunized with a T-dependent antigen (NP-KLH) at day 21 (B) were stained for cell surface expression of B220, CD21, CD23, GL7 and CD138 and for intra-cytoplasmic expression of GAL1 and analyzed by flow cytometry. B220+CD21+CD23high follicular (FO), B220+CD21highCD23low marginal zone (MZ), B220+CD21CD23 early transitional and B220+GL7+ germinal center (GC) B cells and B220lowCD138+ plasma cells (PC) are indicated. Cells from Lgals1−/− mice were similarly stained and used as negative controls for GAL1 expression. Histograms for Lgals1−/− and WT mice are filled in grey and white, respectively. Data are representative of more than 5 independent experiments with at least 4 mice per group. (C) Immunohistofluorescence was done on spleen sections of mice immunized with a T-independent antigen (NP-Ficoll), 7 days after injection. Anti-GAL1, anti-IgM, anti IgG and NP-PE staining were also performed. A representative extra-follicular zone (low nuclei density) of the spleen is shown. Images are representative of more than 5 different fields from 5 immunized mice. GAL1 is in green, IgM, IgG and NP in red and nuclei in blue (D) Immunohistofluorescence was done on bone marrow sections of mice immunized with a T-dependent Ag (NP-KLH), 8 days after the secondary injection. Anti-GAL1 and anti-IgG staining were performed and a representative field of the bone marrow is shown. GAL1 is in green and IgG in red. Asterisks show double-stained cells. The image is representative of 3 different fields from 2 immunized mice. (E) Spleen (left top panel) and bone marrow (right top panel) cells from NP-KLH immunized Blimp1gfp mice at day 15, were stained with anti-GAL1, anti-CD138 and anti-B220. The mean fluorescence intensity (MFI) of GAL1 staining for B cells (B220+), PBs (CD138+GFPlow) and fully differentiated PCs (CD138+GFPhigh) in the spleen (left lower panel) and bone marrow (right lower panel) are shown. The legend of the histograms is indicated on the Figure. Data are representative of 2 independent experiments with 4 mice per group. * indicates significance between conditions with p<0.05.
Figure 2
Figure 2. Serum immunoglobulin levels are decreased in immunized Lgals1−/− mice
WT and Lgals1−/− mice were immunized with NP-Ficoll (T-independent antigen), 7 mice for each group (A) and with NP-KLH in alum (T-dependent antigen), 5 mice for each group (B, C) and Ig secretion in serum was quantified by ELISA. NP-specific IgM and IgG3 levels were determined at D2, D5, D8 and D15 for the T-independent responses (A). NP-specific IgM (B), low (NP23) and high (NP3) NP-specific IgG1 serum titers (C) were analyzed at D2, D5, D15, D18, and D21 for T-dependent responses. (D) Affinity maturation of T-dependent immune responses at days 18 and 21 was measured by the NP3 (high) / NP23 (low) affinity IgG1 ratio. Open and black squares correspond to WT and Lgals1−/− mice, respectively. * and ** indicate significance versus WT mice with p<0.05 and <0.005 respectively.
Figure 3
Figure 3. In vivo generated plasma cells are altered in Lgals1−/− mice
WT and Lgals1−/− mice were immunized with NP-KLH in alum. The numbers of NP-specific IgM and IgG1 ASC in the spleen (A) and bone marrow (B) of WT and Lgals1−/− mice were evaluated by ELISPOT. Studies were performed in triplicate with at least 5 mice per group. Affinity maturation was measured by the NP3 (high)/NP23 (low) affinity ASC ratio in spleen (C) and in bone marrow (D) at day 21 and day 40. Data are means of 2 independent experiments with 4 mice per group. Open and black squares correspond to WT and Lgals1−/− mice, respectively. * and ** indicate significance versus WT mice with p<0.05 and <0.005 respectively.
Figure 4
Figure 4. Immunoglobulin levels are decreased in in vitro generated Lgals1−/− plasmablasts
B220+ splenic B cells from WT and Lgals1−/− mice were enriched by magnetic selection and cultured during 4 days in the presence of 1μg/ml of LPS in complete RPMI medium with 10% FCS. The percentage (A) and the absolute cell number (B) of B220lowCD138+ PB generated from 106 B220+ spleen cells 4 days after stimulation were evaluated by flow cytometry. (C) GAL1 expression in non-stimulated and in LPS-stimulated B cells was determined by Q-PCR at days 1 and 2 after stimulation. (D, E) IgM and IgG3 secretion in culture supernatants from WT and Lgals1−/− cells were quantified by ELISA. Cultures were performed in culture medium supplemented with 10% (D) or 5% (E) FCS and cells were allowed to secrete Ig for 16h. (F) The number of antibody-secreted cells (ASC) obtained from 1000 viable plated cells after WT and Lgas1−/− cultures performed in 10% and 5% FCS, was determined by ELISPOT. Data are representative of more than 5 independent experiments. (G) Absolute number of B220low CD138+ PB generated from 106 B220+ spleen cells in the presence of 5% FCS and after 4 days of LPS stimulation. (H) Incorporation of 3H thymidine at day 2 and 3 (evaluated in cpm) by LPS stimulated B220+ cells in the presence of 10% and 5% FCS. Open and black squares correspond to WT and Lgals1−/− mice, respectively. * indicates significance versus WT mice with p<0.05.
Figure 5
Figure 5. In vitro and in vivo generated Lgals1−/− plasmablasts are more susceptible to apoptosis than WT plasmablasts
(A-C) B220+ splenic B cells from WT and Lgals1−/− mice were cultured with 1μg/ml LPS during 3 days in complete medium containing 10% or 5% FCS. (A) Quantification of apoptotic B220lowCD138+ plasmablasts was determined by 7-AAD incorporation. (B) Quantification of mitochondrial depolarization and phosphatidyl serine externalization on B220lowCD138+ plasmablasts using mitotracker and annexin V staining. Lived cells are mitotrackerhigh/annexinV, cells with externalized phosphatidyl serines are mitotrackerhigh/annexinV+ and cells with a decreased mitochondirial potential are mitotrackerlow/annexinV+. (C) Quantification of caspase 8 activation. Fold changes in active caspase 8 MFI in B220lowCD138+ plasmablasts generated in culture medium supplemented with 10% or 5% FCS are represented. Data in A and B are representative of 3 independent experiments. (D) WT and Lgals1−/− mice were immunized with NP-KLH in alum (T-dependent Ag), 6 mice for each group, and the percentage of splenic apoptotic cells within IgM+CD138+ cells was quantified using TUNEL assays at day 21. For WT and Lgas1−/− mice 3893 and 2154 cells were counted, respectively. * and ** indicate significance versus WT mice with p<0.05 and <0.005 respectively.

References

    1. Barondes SH, Castronovo V, Cooper DN, Cummings RD, Drickamer K, Feizi T, Gitt MA, Hirabayashi J, Hughes C, Kasai K, et al. Galectins: a family of animal beta-galactoside-binding lectins. Cell. 1994;76:597–598. - PubMed
    1. Bourne Y, Bolgiano B, Liao DI, Strecker G, Cantau P, Herzberg O, Feizi T, Cambillau C. Crosslinking of mammalian lectin (galectin-1) by complex biantennary saccharides. Nat struct biol. 1994;1:863–870. - PubMed
    1. Dagher SF, Wang JL, Patterson RJ. Identification of galectin-3 as a factor in pre-mRNA splicing. P Natl Acad Sci USA. 1995;92:1213–1217. - PMC - PubMed
    1. Vyakarnam A, Dagher SF, Wang JL, Patterson RJ. Evidence for a role for galectin-1 in pre-mRNA splicing. Mol Cell Biol. 1997;17:4730–4737. - PMC - PubMed
    1. Hughes RC. Secretion of the galectin family of mammalian carbohydrate-binding proteins. Biochim Biophys Acta. 1999;1473:172–185. - PubMed

Publication types

MeSH terms