. 2013 Jun;162(2):842-57.
doi: 10.1104/pp.113.214049. Epub 2013 Apr 24.

EBE, an AP2/ERF transcription factor highly expressed in proliferating cells, affects shoot architecture in Arabidopsis

Affiliations

EBE, an AP2/ERF transcription factor highly expressed in proliferating cells, affects shoot architecture in Arabidopsis

Mohammad Mehrnia et al. Plant Physiol. 2013 Jun.

Abstract

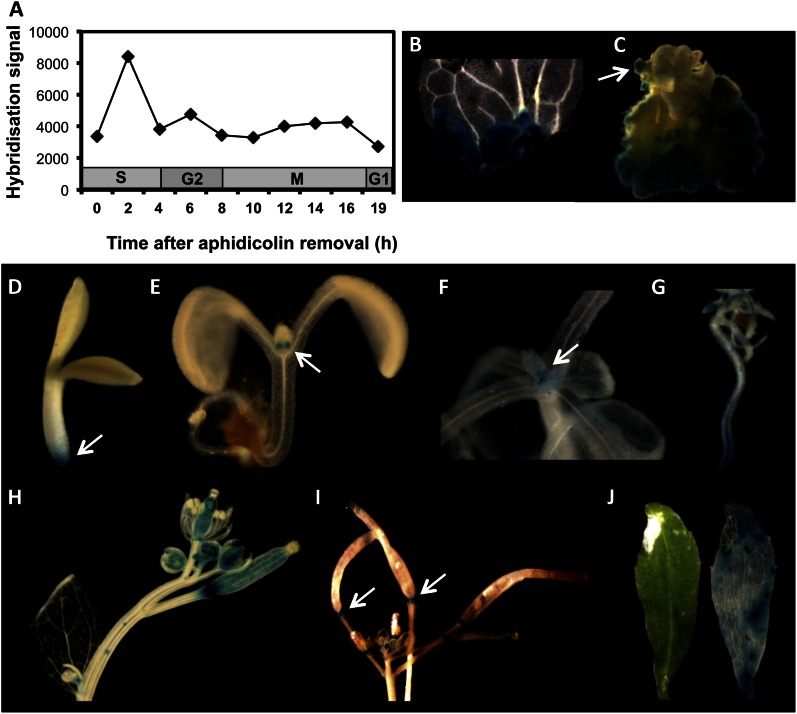
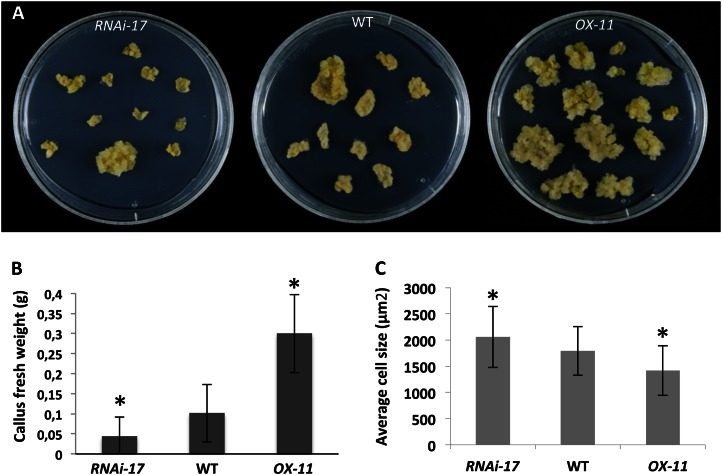
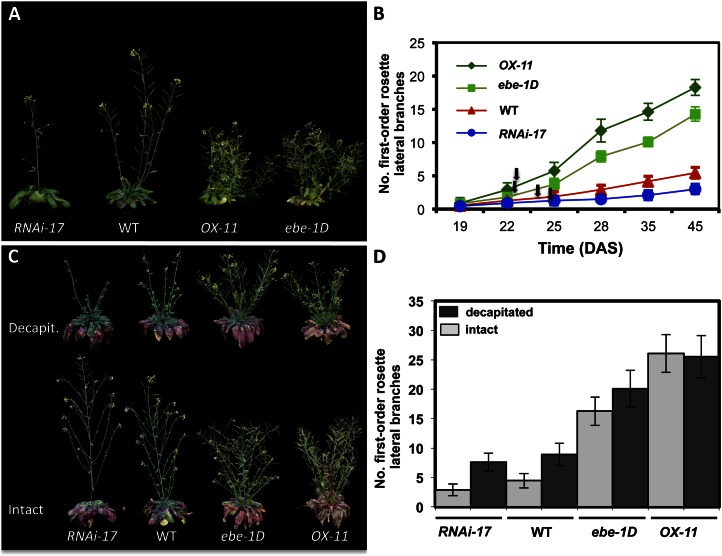
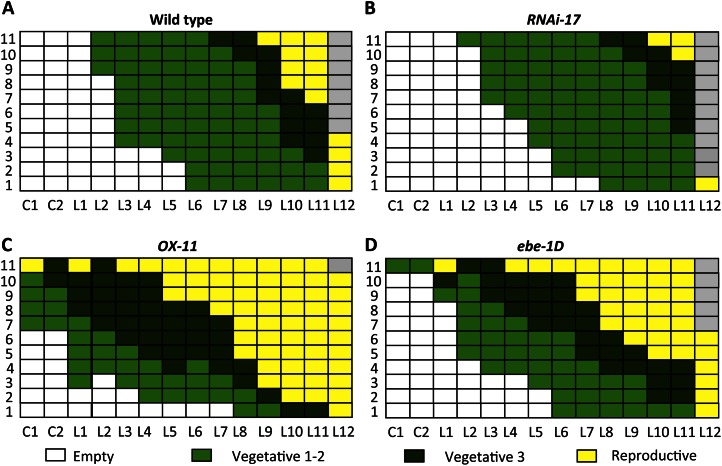
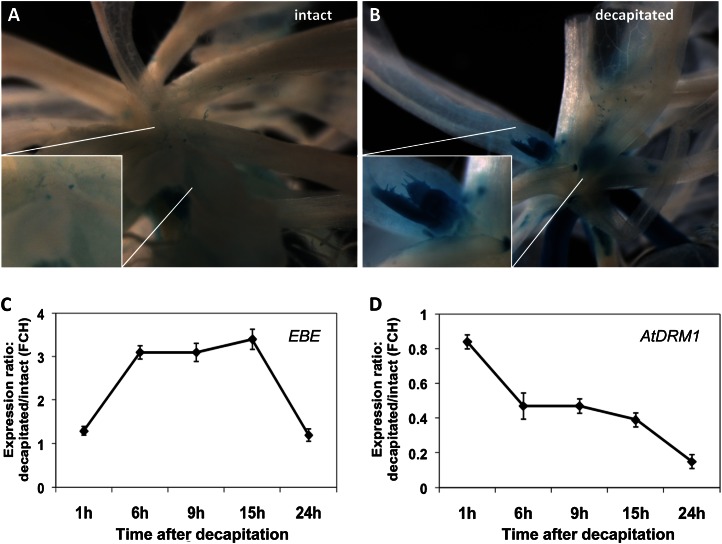
We report about ERF BUD ENHANCER (EBE; At5g61890), a transcription factor that affects cell proliferation as well as axillary bud outgrowth and shoot branching in Arabidopsis (Arabidopsis thaliana). EBE encodes a member of the APETALA2/ETHYLENE RESPONSE FACTOR (AP2/ERF) transcription factor superfamily; the gene is strongly expressed in proliferating cells and is rapidly and transiently up-regulated in axillary meristems upon main stem decapitation. Overexpression of EBE promotes cell proliferation in growing calli, while the opposite is observed in EBE-RNAi lines. EBE overexpression also stimulates axillary bud formation and outgrowth, while repressing it results in inhibition of bud growth. Global transcriptome analysis of estradiol-inducible EBE overexpression lines revealed 48 EBE early-responsive genes, of which 14 were up-regulated and 34 were down-regulated. EBE activates several genes involved in cell cycle regulation and dormancy breaking, including D-type cyclin CYCD3;3, transcription regulator DPa, and BRCA1-ASSOCIATED RING DOMAIN1. Among the down-regulated genes were DORMANCY-ASSOCIATED PROTEIN1 (AtDRM1), AtDRM1 homolog, MEDIATOR OF ABA-REGULATED DORMANCY1, and ZINC FINGER HOMEODOMAIN5. Our data indicate that the effect of EBE on shoot branching likely results from an activation of genes involved in cell cycle regulation and dormancy breaking.


Figures

Figure 1.
Figure 1.
EBE expression. A, EBE expression during cell cycle progression. Data were extracted from Menges et al. (2003), using Genevestigator. B to J, EBE promoter-driven GUS activity. B and C, GUS activity in calli and regenerating shoot (arrow in C). D and E, Three- and 9-d-old seedlings, respectively. Note GUS staining in the root tip and stipules (arrows). F, Shoot, with staining at the apex (arrow). G, Roots. H, Flowers and young siliques. I, Old siliques, with GUS staining in abscission zones (arrows). J, Senescent leaf: left, unstained; right, GUS stained. Incubation in GUS staining solution was done overnight.
Figure 2.
Figure 2.
Effects of altered EBE expression on callus formation. A and B, Overexpression of EBE increases callus size. Data in B represent mean fresh weight ± sd of at least 30 calli, grown in three independent biological experiments. C, Size of cells in calli. Data are means of at least 120 cells each ± sd. In B, asterisks indicate statistically significant differences between the wild type (WT) and either EBE-RNAi-17 or 35S:EBE (OX-11) calli (Student’s t test after false discovery rate correction, P < 0.01). In C, asterisks indicate statistically significant differences between EBE-RNAi-17 and 35S:EBE (OX-11) calli (Student’s t test, P < 0.05).
Figure 3.
Figure 3.
Phenotypic effects of altered EBE transcript level. A, Phenotypes of 33-d-old transgenic EBE lines compared with wild-type (WT) plants, grown in long-day conditions. B, Number of first-order rosette lateral branches in 35S:EBE (OX-11), ebe-1D, wild-type, and EBE-RNAi-17 plants. Given are means ± sd of 11 different plants of each line at each stage. At time points 28, 35, and 45 d after sowing (DAS), the differences between wild-type and all transgenic plants are statistically significant (Student’s t test after false discovery rate correction, P < 0.01). Arrows indicate flowering time for each line. Flowering time of the transgenic plants did not significantly differ from that of the wild type under our experimental conditions (Student’s t test after false discovery rate correction, P > 0.05; Supplemental Table S5). C, Phenotype of transgenic plants 12 d after decapitation (top) compared with intact plants that were not decapitated (bottom). Plants were 3 months old. D, Number of first-order rosette lateral branches of wild-type and transgenic plants at 12 d after removal of the main shoot, compared with intact plants. In wild-type plants, approximately 50% of the buds in primary rosette branches grew out, whereas in RNAi, ebe-1D, and OX-11 lines, approximately 38%, 80%, and 100%, respectively, of the buds did. Data represent means ± sd (n = 11). Data for intact versus decapitated plants were significantly different for all lines except the strong EBE overexpressor line OX-11 (Student’s t test, P < 0.01).
Figure 4.
Figure 4.
Developmental stages of buds in the axils of cotyledons (C1 and C2) and rosette leaves (L1–L12) shown on the x axis. The experiment was performed with 11 4-week-old plants grown under long-day conditions, indicated by numbers on the y axis. As EBE-RNAi-17 lines had developed approximately 12 leaves at the analysis time point, data of 12 rosette leaves (L1–L12) are presented for all lines. A, The wild type. B, EBE-RNAi-17. C, 35S:EBE (OX-11). D, ebe-1D. The bud developmental gradient was found to be more pronounced in EBE-RNAi lines than in the wild type but to be less obvious in 35S:EBE and ebe-1D lines. Developmental stages are as follows: vegetative 1, buds with two or more leaf primordia formed, no trichomes, 150 to 250 µm; vegetative 2, mid vegetative stage, buds with differentiating trichome-bearing leaf primordia, less than 400 µm; vegetative 3, late vegetative stage, buds with expanding trichome-bearing leaf primordia, more than 400 µm; reproductive, flower meristems visible within the bud.
Figure 5.
Figure 5.
Altered EBE expression before and after decapitation. A and B, GUS staining of axillary shoots before (A) and 6 h after (B) main stem decapitation. C and D, qRT-PCR analysis of EBE (C) and AtDRM1 (D) expression in the five uppermost axillary shoots after main stem decapitation. Symbols in both panels represent means ± sd of three biological experiments. FCH, Fold change.
Figure 6.
Figure 6.
Effects of altered EBE expression on plant phenotype. A, EBE up-regulation causes an increase and its down-regulation causes a decrease of the leaf initiation rate as compared with the wild type (WT). Threads of the following colors were used for labeling rosette leaves: orange for leaves L1 and L2, yellow for leaves L3 and L4, and white for leaves L5 and L6. B, Number of rosette leaves of transgenic and wild-type plants during a period of 4 weeks. The symbols represent means ± sd of 11 plants at each time point. At 30 d after sowing (DAS), there is a statistically significant difference between the wild type and all transgenic plants (Student’s t test after false discovery rate correction, P < 0.05). C, Altered phyllotaxy and SAM size in transgenic plants compared with the wild type. The left panel shows an enlarged SAM in a 35S:EBE plant (OX-11) that had arrested without developing further. The right panel shows an arrested SAM in the EBE-RNAi-50 line that occurred after cotyledon development. The three middle panels show the changed phyllotaxy of transgenic plants in comparison with the wild type. In some of the 35S:EBE plants, the angle between the two first true leaves was only about 120°, while in EBE-RNAi plants, the angle was more than 150°C.
Figure 7.
Figure 7.
Overrepresentation analysis of cis-regulatory motifs in the promoters of early EBE target genes. A, Overrepresentation of the GTCGAC motif in the promoters of the 48 early target genes compared with the background. B, The TATCC motif (SRE) is more abundant in the promoters of the 34 down-regulated EBE early target genes than in the background data set. C and D, Overrepresentation of TCP target sites in the promoters of the 48 EBE downstream targets. All analyses were performed using the POBO program. Dashed lines indicate the occurrence of motifs in EBE downstream genes, and solid lines indicate the occurrence of motifs in the background data set.

References

    1. Aggarwal P, Padmanabhan B, Bhat A, Sarvepalli K, Sadhale PP, Nath U. (2011) The TCP4 transcription factor of Arabidopsis blocks cell division in yeast at G1→S transition. Biochem Biophys Res Commun 410: 276–281 - PubMed
    1. Aguilar-Martínez JA, Poza-Carrión C, Cubas P. (2007) Arabidopsis BRANCHED1 acts as an integrator of branching signals within axillary buds. Plant Cell 19: 458–472 - PMC - PubMed
    1. Bainbridge K, Guyomarc’h S, Bayer E, Swarup R, Bennett M, Mandel T, Kuhlemeier C. (2008) Auxin influx carriers stabilize phyllotactic patterning. Genes Dev 22: 810–823 - PMC - PubMed
    1. Bakan B, Hamberg M, Perrocheau L, Maume D, Rogniaux H, Tranquet O, Rondeau C, Blein J-P, Ponchet M, Marion D. (2006) Specific adduction of plant lipid transfer protein by an allene oxide generated by 9-lipoxygenase and allene oxide synthase. J Biol Chem 281: 38981–38988 - PubMed
    1. Balazadeh S, Riaño-Pachón DM, Mueller-Roeber B. (2008) Transcription factors regulating leaf senescence in Arabidopsis thaliana. Plant Biol (Stuttg) (Suppl 1) 10: 63–75 - PubMed

MeSH terms

Associated data