. 2013 Jun;19(6):811-27.
doi: 10.1261/rna.039081.113. Epub 2013 Apr 24.

Splicing kinetics and transcript release from the chromatin compartment limit the rate of Lipid A-induced gene expression

Affiliations

Splicing kinetics and transcript release from the chromatin compartment limit the rate of Lipid A-induced gene expression

Amy Pandya-Jones et al. RNA. 2013 Jun.

Abstract

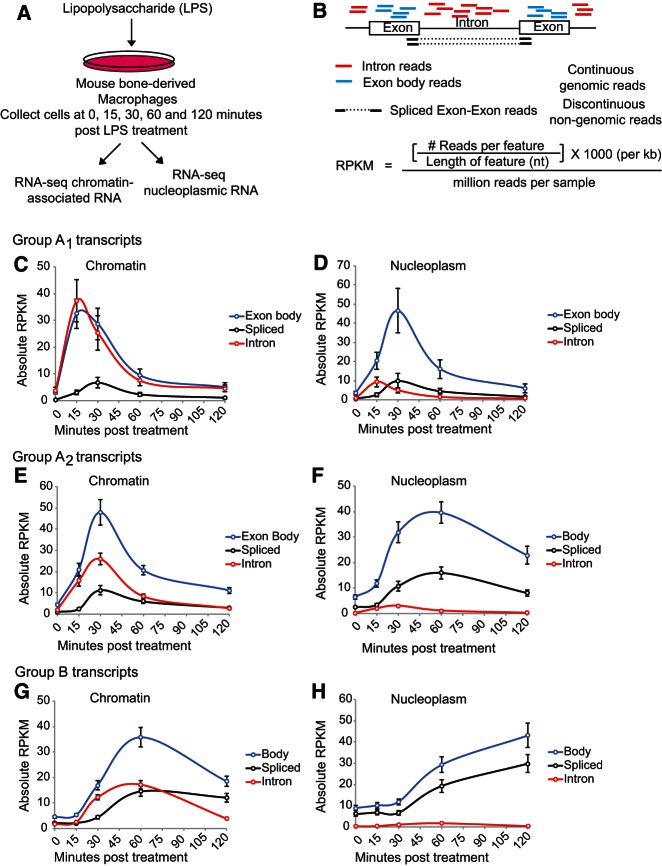
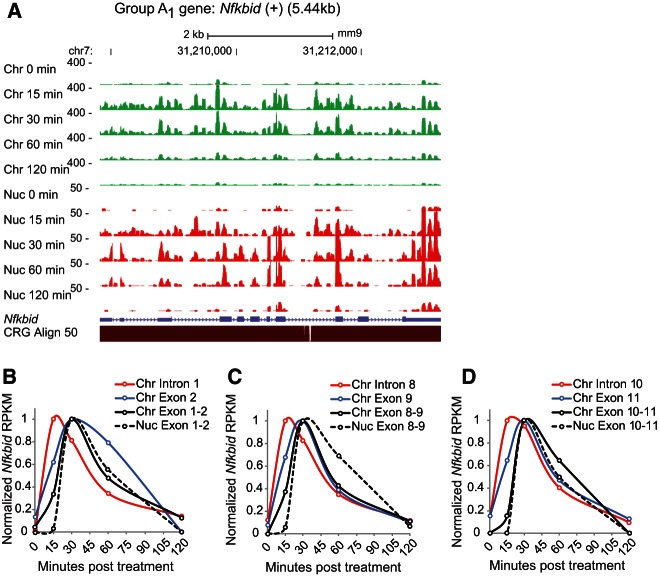
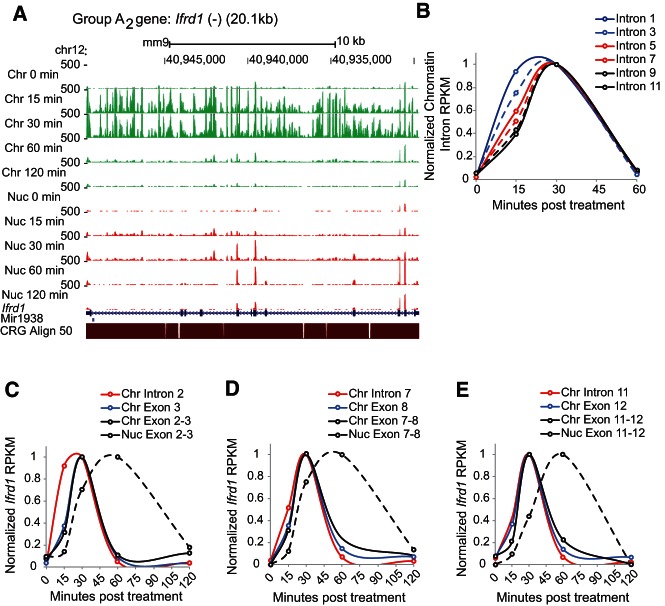
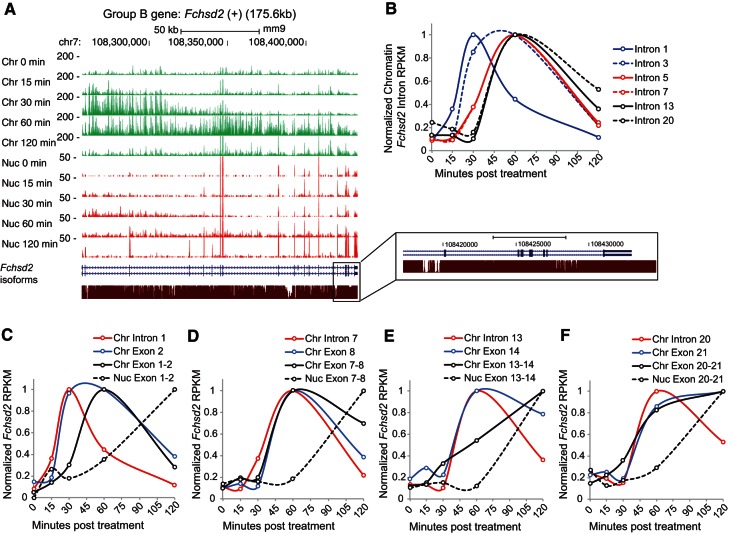
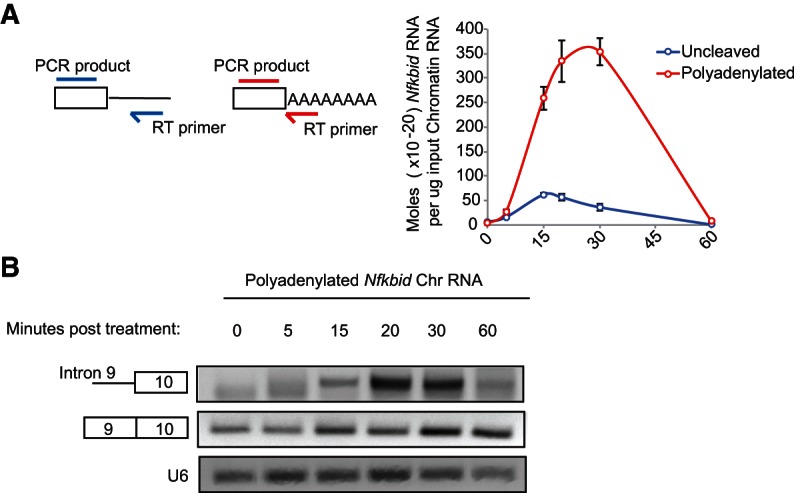
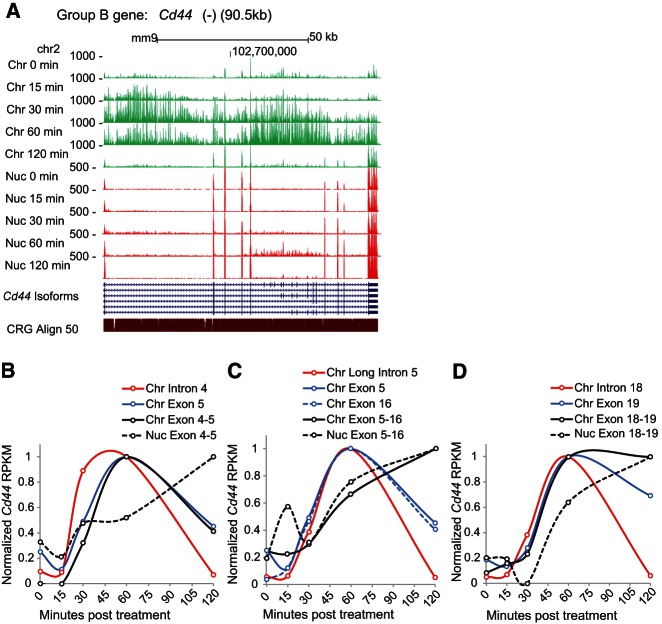
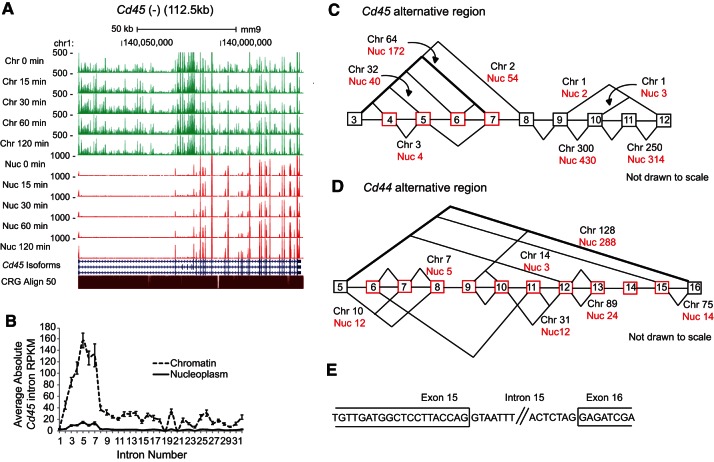
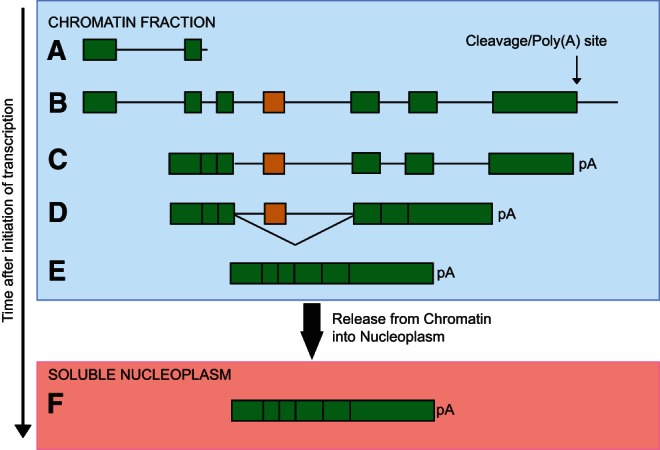
The expression of eukaryotic mRNAs is achieved though an intricate series of molecular processes that provide many steps for regulating the production of a final gene product. However, the relationships between individual steps in mRNA biosynthesis and the rates at which they occur are poorly understood. By applying RNA-seq to chromatin-associated and soluble nucleoplasmic fractions of RNA from Lipid A-stimulated macrophages, we examined the timing of exon ligation and transcript release from chromatin relative to the induction of transcription. We find that for a subset of genes in the Lipid A response, the ligation of certain exon pairs is delayed relative to the synthesis of the complete transcript. In contrast, 3' end cleavage and polyadenylation occur rapidly once transcription extends through the cleavage site. Our data indicate that these transcripts with delayed splicing are not released from the chromatin fraction until all the introns have been excised. These unusual kinetics result in a chromatin-associated pool of completely transcribed and 3'-processed transcripts that are not yet fully spliced. We also find that long introns containing repressed exons that will be excluded from the final mRNA are excised particularly slowly relative to other introns in a transcript. These results indicate that the kinetics of splicing and transcript release contribute to the timing of expression for multiple genes of the inflammatory response.

Keywords: gene expression; inflammatory response; mRNA maturation; pre-mRNA splicing; splicing kinetics.


Figures

FIGURE 1.
FIGURE 1.
RNA synthesis and splicing can be resolved over time on Lipid A-responsive genes. (A) In vitro differentiated mouse macrophages were treated with Lipid A and collected at 0, 15, 30, 60, or 120 min post-simulation. Chromatin-associated and nucleoplasmic RNA fractions from the same biological sample, for each time point, were analyzed by RNA-seq. (B) Reads mapping to genic regions were classified by their location. Continuously mapping genomic reads include the following: exon body reads (blue) that map entirely within exons; intron reads (red) that map entirely within introns; spliced reads (black) mapping discontinuously to the genome represent reads that cross a spliced exon–exon junction. (C) Line graph representing the total RPKM of exon body (blue), intron (red), and spliced reads (black) averaged from all chromatin-associated Group A1 transcripts at each time point post-Lipid A treatment. (D) Same as C except that the exon, intron, and spliced RPKMs were calculated for all nucleoplasmic Group A1 transcripts. (E) Same as C except that RPKMs were calculated for all chromatin-associated Group A2 transcripts. (F) Same as D except that RPKMs were calculated for all nucleoplasmic Group A2 transcripts. (G) Same as C except that RPKMs were calculated for all chromatin-associated Group B transcripts. (H) Same as D except that RPKMs were calculated for all nucleoplasmic Group B transcripts. In all figures, error bars represent the standard error of the mean.
FIGURE 2.
FIGURE 2.
Splicing and release of Nfkbid transcripts. (A) Plot of all reads mapping to the 5.44-kb Nfkbid gene from the chromatin (green) and nucleoplasmic (red) fractions at each time point post-Lipid A treatment aligned to the UCSC genome browser track. The gene structure and mappability for the 50-nt reads are depicted below. (BD) Line graphs representing the RPKM (normalized to the maximum value) of individual intron (red) or exon (blue) regions within the Nfkbid gene in the chromatin fraction at each time point post-Lipid A treatment. The normalized read numbers mapping to the corresponding exon–exon junctions in the chromatin fraction (black, solid) and nucleoplasm (black, dashed) are also plotted.
FIGURE 3.
FIGURE 3.
mRNA release from chromatin can be significantly delayed relative to synthesis. (A) Plot of all reads mapping to the 20.1-kb Ifrd1 gene from the chromatin (green) and nucleoplasmic (red) fractions at each time point post-Lipid A treatment aligned to the UCSC genome browser track. The gene structure and mappability for the 50-nt reads are depicted below. Note that intron 1 contains the gene for mir1938. A microsatellite repeat across the intron 1–exon 2 junction prevents identification of 3′ intron junction and spliced exon 1–2 reads. (B) Line graph showing the RPKM (normalized by the maximum value) of the odd-numbered lfrd1 introns within chromatin-associated transcripts at each time point post-Lipid A treatment. (CE) Line graphs of the normalized RPKM for individual intron (red) or exon (blue) regions within the Ifrd1 gene in the chromatin fraction. Reads mapping to the corresponding exon–exon junctions in the chromatin fraction (black, solid) and nucleoplasm (black, dashed) are also shown.
FIGURE 4.
FIGURE 4.
Splicing catalysis on long pre-mRNAs can be greatly delayed relative to transcription. (A) Plot of all reads mapping to the 175.2-kb Fchsd2 gene from the chromatin (green) and nucleoplasmic (red) fractions at each time point post-Lipid A treatment aligned to the UCSC genome browser track. The gene structure and mappability for the 50-nt reads are depicted below. For clarity, an enlargement of the 3′ region of the gene is included. (B) Line graph showing the normalized RPKM of introns within chromatin-associated Fchsd2 transcripts. (CF) Line graphs representing the RPKM of individual intron (red) or exon (blue) regions within the Fchsd2 gene in the chromatin fraction. The reads mapping to the corresponding exon–exon junctions in the chromatin fraction (black, solid) and nucleoplasm (black, dashed) are also shown.
FIGURE 5.
FIGURE 5.
Polyadenylation can precede splicing on chromatin. (A) Line graph showing the molar amount of Nfkbid 3′ terminal exon per microgram of input chromatin-associated RNA at times post-Lipid A simulation. The RNA was primed for reverse transcription using either a primer downstream from the cleavage site (blue) or one complementary to the poly(A) tail (red). Error bars represent the standard error of the mean. (B) Ethidium bromide stained agarose gel showing the PCR product of the Nfkbid intron 9–exon 10 junction (35 cycles) and the corresponding exon 9–exon 10 spliced product (35 cycles) within the chromatin fraction at times post-Lipid A stimulation. We note that the intron 9–exon 10 product is short, and appears at the 30-min time point. The band visible at the 0- and 15-min time points is a primer dimer. A PCR product (25 cycles) amplified from the U6 snRNA cDNA served as a loading control.
FIGURE 6.
FIGURE 6.
The long Cd44 intron containing skipped exons is spliced more slowly than adjacent constitutive introns. (A) Genome browser tracks of reads mapping to the 90.5-kb Cd44 gene in the chromatin (green) and nucleoplasmic (red) fractions. Alternating SINE and LINE elements interfere in the analysis of reads that map to exon 2. (BD) Line graphs representing the RPKM of individual intron (red) or exon (blue) regions within the Cd44 gene in the chromatin fraction. The reads mapping to the corresponding exon–exon junctions in the chromatin fraction (black, solid) and nucleoplasm (black, dashed) are also shown.
FIGURE 7.
FIGURE 7.
Aberrant splicing of skipped alternative exons. (A) Genome browser tracks of reads mapping to the 112.5-kb Cd45 gene in the chromatin (green) and nucleoplasmic (red) fractions. This gene is constitutively expressed, thus each time point can be considered a biological replicate. (B) Line graph showing the total RPKM for each intron of the Cd45 gene in the chromatin and nucleoplasmic fractions, averaged over all five time points. Error bars represent the standard error of the mean. (C) Diagram of Cd45 exons 3–12. Exons 4–7 outlined in red are alternative, although in macrophages the dominant isoform includes exon 7. Diagonal lines join exons where chromatin-associated splicing events were observed. The predominant alternative splicing pattern is shown in bold. Numbers indicate the number of reads mapping to the indicated junction averaged over all five time points in the chromatin fraction. For clarity, the information for all junctions within the depicted region is not included. (D) A diagram of the Cd44 alternative region. Constitutive exons 5 and 16 are outlined in black, and alternative exons 6–15 in red. Diagonal lines join exons where splicing events were observed. Bold lines depict productive splicing between exons 5 and 16. Numbers report the reads per event at 60 min on the chromatin. For clarity, the information for all junctions is not included. The values shown are representative of the range in read number per junction found across the Cd44 alternative region. (E) Sequence of the 3′ end of exon 15 and the 5′ end of exon 16 in the Cd44 gene.
FIGURE 8.
FIGURE 8.
The sequence of maturation events observed for Lipid A-induced transcripts. We find that splicing and transcript release from chromatin are slow relative to RNA synthesis and 3′ end cleavage. This gives rise to the following sequence of events for Lipid A-induced transcripts. (A) Transcription initiates upon Lipid A stimulation. (B) Transcription of the gene completes. Some splicing likely initiates prior to this, but for the genes assayed here, spliced read accumulation largely coincided with the time of transcript completion or later. (C) Cleavage and polyadenylation at the 3′ splice site is rapid once transcription proceeds across the site. Introns are removed roughly in a 5′-to-3′ order along the transcript. (D) Introns encompassing an alternative exon that is to be excluded from the final message are spliced especially slowly. (E) Fully processed, mature mRNAs are released from the DNA template. (F) RNA released into the nucleoplasm is largely complete.

Similar articles

Cited by

References

    1. Abruzzi KC, Belostotsky DA, Chekanova JA, Dower K, Rosbash M 2006. 3′-end formation signals modulate the association of genes with the nuclear periphery as well as mRNP dot formation. EMBO J 25: 4253–4262 - PMC - PubMed
    1. Alexander RD, Barrass JD, Dichtl B, Kos M, Obtulowicz T, Robert MC, Koper M, Karkusiewicz I, Mariconti L, Tollervey D, et al. 2010a. RiboSys, a high-resolution, quantitative approach to measure the in vivo kinetics of pre-mRNA splicing and 3′-end processing in Saccharomyces cerevisiae. RNA 16: 2570–2580 - PMC - PubMed
    1. Alexander RD, Innocente SA, Barrass JD, Beggs JD 2010b. Splicing-dependent RNA polymerase pausing in yeast. Mol Cell 40: 582–593 - PMC - PubMed
    1. Ameur A, Zaghlool A, Halvardson J, Wetterbom A, Gyllensten U, Cavelier L, Feuk L 2011. Total RNA sequencing reveals nascent transcription and widespread co-transcriptional splicing in the human brain. Nat Struct Mol Biol 18: 1435–1440 - PubMed
    1. Ardehali MB, Lis JT 2009. Tracking rates of transcription and splicing in vivo. Nat Struct Mol Biol 16: 1123–1124 - PubMed

Publication types

MeSH terms