. 2013 Jul;87(13):7445-62.
doi: 10.1128/JVI.00865-13. Epub 2013 Apr 24.

Early Gag immunodominance of the HIV-specific T-cell response during acute/early infection is associated with higher CD8+ T-cell antiviral activity and correlates with preservation of the CD4+ T-cell compartment

Affiliations

Early Gag immunodominance of the HIV-specific T-cell response during acute/early infection is associated with higher CD8+ T-cell antiviral activity and correlates with preservation of the CD4+ T-cell compartment

Gabriela Turk et al. J Virol. 2013 Jul.

Abstract

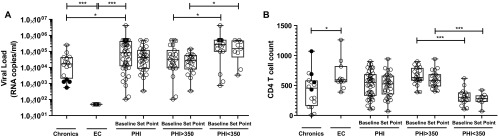
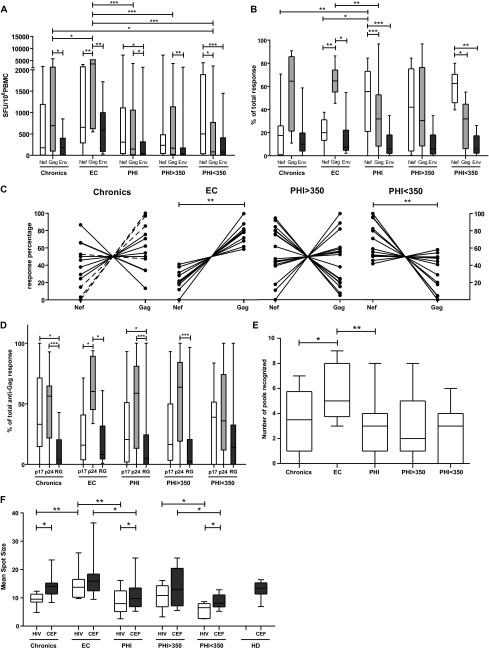
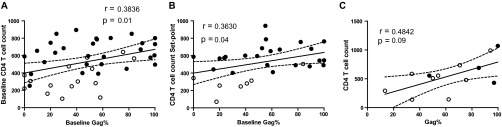
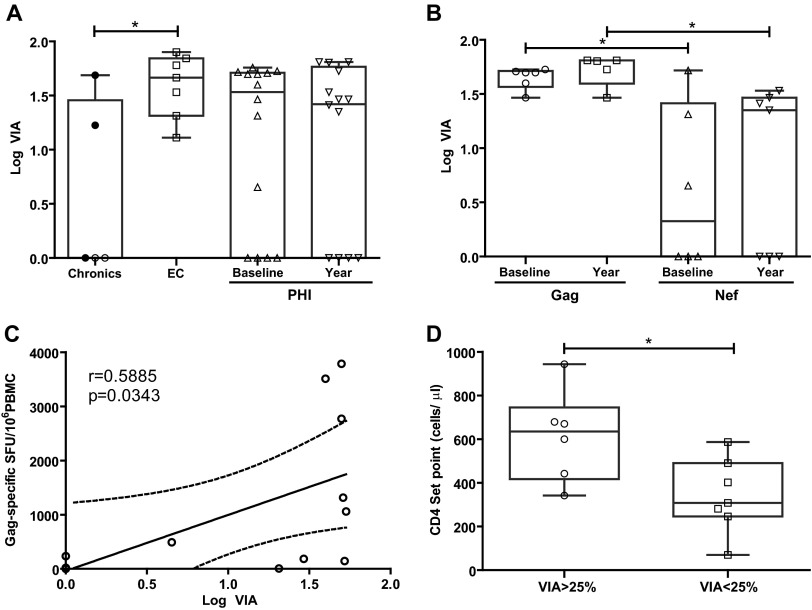
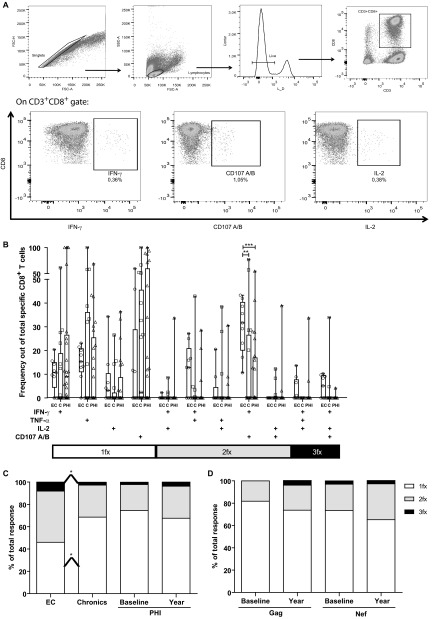
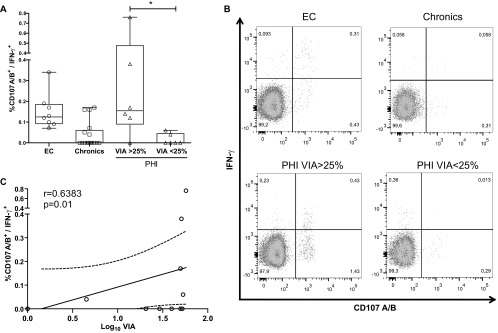
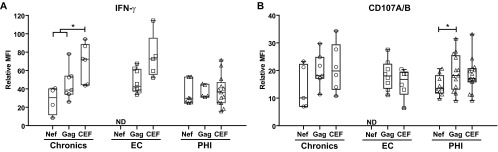
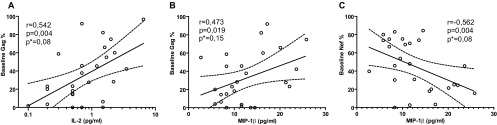
The important role of the CD8(+) T-cell response on HIV control is well established. Moreover, the acute phase of infection represents a proper scenario to delineate the antiviral cellular functions that best correlate with control. Here, multiple functional aspects (specificity, ex vivo viral inhibitory activity [VIA] and polyfunctionality) of the HIV-specific CD8(+) T-cell subset arising early after infection, and their association with disease progression markers, were examined. Blood samples from 44 subjects recruited within 6 months from infection (primary HIV infection [PHI] group), 16 chronically infected subjects, 11 elite controllers (EC), and 10 healthy donors were obtained. Results indicated that, although Nef dominated the anti-HIV response during acute/early infection, a higher proportion of early anti-Gag T cells correlated with delayed progression. Polyfunctional HIV-specific CD8(+) T cells were detected at early time points but did not associate with virus control. Conversely, higher CD4(+) T-cell set points were observed in PHI subjects with higher HIV-specific CD8(+) T-cell VIA at baseline. Importantly, VIA levels correlated with the magnitude of the anti-Gag cellular response. The advantage of Gag-specific cells may result from their enhanced ability to mediate lysis of infected cells (evidenced by a higher capacity to degranulate and to mediate VIA) and to simultaneously produce IFN-γ. Finally, Gag immunodominance was associated with elevated plasma levels of interleukin 2 (IL-2) and macrophage inflammatory protein 1β (MIP-1β). All together, this study underscores the importance of CD8(+) T-cell specificity in the improved control of disease progression, which was related to the capacity of Gag-specific cells to mediate both lytic and nonlytic antiviral mechanisms at early time points postinfection.


Figures

Fig 1
Fig 1
Viral load (A) and CD4+ T-cell count (B) of enrolled HIV+ subjects per study group. For PHI subjects, values corresponding to both baseline and set point are shown. Also, PHI subjects are shown as a whole group (PHI) and split into PHI > 350 and PHI < 350 subgroups whether their CD4+ T-cell count dropped below 350 cells/μl at any time during the first year postinfection or not. Within the chronic group, black dots correspond to viremic controllers (see Table S1 in the supplemental material and the text). Horizontal lines stand for median values. P values were calculated using Mann-Whitney test. VEGF, vascular endothelial growth factor; MDC, macrophage-derived chemokine; GRO, growth-related protein. Asterisks denote different P values: *, P < 0.05; ***, P < 0.005.
Fig 2
Fig 2
ELISPOT screening of HIV-specific T-cell response magnitude, immunodominant targets, breadth, and functionality in primary HIV infection (PHI, baseline samples), chronic, and elite controller (EC) groups. (A) Magnitude of total anti-Nef, anti-Gag, and anti-Env T-cell responses, expressed as SFU/106 PBMC. (B) Contribution of each antigen relative to the total HIV response expressed as the percentage out of the total sum of the specific response (sum of the magnitude obtained for all Nef, Gag, and Env antigens). (C) Contribution of anti-Nef and anti-Gag responses (relative to the sum of the magnitude obtained for both antigens) on a subject-by-subject basis (each represented by a line) in chronic, EC, and PHI groups. “Viremic chronics” are denoted in the corresponding panel with dashed lines. (D) Gag subunits targeted per study group, expressed as percentage out of the total anti-Gag response. RG = p2p7p1p6. (E) Breadth of the response expressed as the number of peptide pools recognized out of the 9 HIV pools assayed. (F) Mean spot size obtained for both CEF and HIV peptide pools. HIV mean spot sizes represent the average mean spot sizes out of all Nef, Gag, and Env pools for which a positive response was obtained in the ELISPOT assay on a subject-by-subject basis. All data presented in the figure for PHI subjects correspond to baseline samples. PHI > 350 and PHI < 350 stand for subgroups within the PHI group in which subjects were segregated according to whether their CD4+ T-cell count dropped below 350 cells/μl at any time during the first year of infection or not. Horizontal lines within boxes represent the median values. Intra- and intergroup differences were analyzed using Wilcoxon and Mann-Whitney tests, respectively. Asterisks denote different P values: *, P < 0.05; **, P < 0.01; ***, P < 0.005.
Fig 3
Fig 3
Correlation between the relative baseline immunodominance of anti-Gag response and CD4+ T-cell counts. (A) Baseline CD4+ T-cell count versus baseline percentage of anti-Gag response in PHI subjects. (B) Set point CD4+ T-cell count versus baseline percentage of anti-Gag response in PHI subjects. (C) CD4+ T-cell count versus percentage of anti-Gag response in chronics. In panels A and B, black and white dots denote PHI > 350 and PHI < 350 subjects, respectively. In panel C, black dots correspond to viremic controllers within the chronic group. All r and P values correspond to Spearman's test.
Fig 4
Fig 4
In vitro viral inhibitory activity (VIA) mediated by HIV-specific CD8+ T cells. VIA is expressed as the log10 of the proportion of p24 antigen lost when CD8+ T cells were present in the culture, compared to CD4+ cells alone. (A) Viral inhibitory activity found in chronic, EC, and PHI subjects, against lab-adapted R5 HIV strains; (B) viral inhibitory activity in PHI individuals, reassorted into subjects with Gag immunodominance or Nef immunodominance according to preferred (>50% of total response) viral protein targeted by the immune response at baseline sample in the ELISPOT assay; (C) correlation between the magnitude of Gag-specific response in PHI subjects at baseline sample and VIA; r and P values correspond to Spearman's test; (D) PHI subjects with substantial capacity to mediate VIA (>25%) also showed higher CD4+ T-cell set points. In panels A, B, and D, symbols show the values for each individual subject. Within the chronic group (A), viremic controllers are denoted with black dots. Horizontal lines within boxes represent the median values. Intergroup and intragroup (PHI baseline versus year) differences were analyzed using Mann-Whitney and Wilcoxon tests, respectively; *, P < 0.05.
Fig 5
Fig 5
(A) Gating strategy used for the identification of degranulating and cytokine-secreting HIV-specific T cells. Illustration data were derived from one representative subject, stimulated with an HIV peptide pool. Initial gating was performed on a plot of forward scatter area (FSC-A) versus height (FSC-H) to remove doublets. Then, gating was performed on small lymphocytes in a plot of forward scatter (FSC) versus side scatter (SSC). Dead cells were then excluded on the bases of LIVE/DEAD fluorescence. Subsequently, CD3+CD8+ cells were gated in a CD3-versus-CD8 dot plot. Following identification of these cells, a gate was made for each function studied: degranulation (evidenced as CD107A/B surface expression) and production of IFN-γ, IL-2, and TNF-α. (B) Relative contribution to the total specific CD8+ response made by each function or function combination in PHI (baseline sample), chronic, and EC subjects. Symbols represent the percentage out of the total specific CD8+ T cells expressing the particular combination of functions indicated on the axis, for each subject. Responses shown correspond to background-subtracted results using the CD28/49d control. Values corresponding to bi- and monofunctional cells were corrected by subtracting the values corresponding to triple-positive events and double- and triple-positive events, respectively. Horizontal lines within boxes represent the median values. (C) Summary of functional profile in chronic, EC, and PHI subjects (baseline and year samples in the case of the PHI group). The distinct cellular subsets shown in panel B were grouped by number of functions, so each section of the bars represent, the mean proportion of specific CD8+ T cells expressing one (white), two (gray), or three (black) functions, independently of any particular function, matching the color code used in panel B. (D) Results corresponding to PHI subjects, using either Gag or Nef peptide pools as stimuli. *, P < 0.05; **, P < 0.01; ***, P < 0.005.
Fig 6
Fig 6
Association between the CD8+ T-cell capacity to suppress HIV replication in vitro and the frequency of HIV-specific T cells able to degranulate and secrete IFN-γ+ upon stimulation. (A) Frequency of HIV-specific CD107A/B+ IFN-γ+ CD8+ T cells in EC, chronic, and PHI subjects (segregated according to CD8+ T-cell VIA magnitude). *, P < 0.05 Mann-Whitney test. (B) Representative IFN-γ+ versus CD107A/B+ dot plots (gated on CD3+CD8+ events) obtained for subjects of each group. (C) Correlation between the frequency of HIV-specific CD107A/B+ IFN-γ+ CD8+ T cells and VIA in PHI subjects at baseline sample. r and P values correspond to Spearman's test.
Fig 7
Fig 7
Relative mean fluorescence intensity (rMFI) of IFN-γ (A) and CD107A/B (B) in Nef-, Gag-, and CEF-specific CD8+ T cells, calculated as the ratio between MFI corresponding to specific versus total CD8+ T cells for a given channel, in chronic, EC, and PHI subjects. Symbols show the values for each individual subject. Horizontal lines within boxes represent the median values. *, P < 0.05; ND, not determined.
Fig 8
Fig 8
Correlation between anti-Gag and anti-Nef cellular immune response immunodominance hierarchy and plasma cytokine/chemokine levels in PHI subjects at baseline samples. Significant correlations were found between the relative immunodominance of Gag (A and B) and Nef (C) with plasma IL-2 (A) and MIP-1β (B and C) levels. r and P values correspond to Spearman's test. *, P values adjusted by the Benjamini and Hochberg method for false discovery rate (FDR) procedure.

References

    1. Rerks-Ngarm S, Pitisuttithum P, Nitayaphan S, Kaewkungwal J, Chiu J, Paris R, Premsri N, Namwat C, de Souza M, Adams E, Benenson M, Gurunathan S, Tartaglia J, McNeil JG, Francis DP, Stablein D, Birx DL, Chunsuttiwat S, Khamboonruang C, Thongcharoen P, Robb ML, Michael NL, Kunasol P, Kim JH. 2009. Vaccination with ALVAC and AIDSVAX to prevent HIV-1 infection in Thailand. N. Engl. J. Med. 361:2209–2220 - PubMed
    1. Freel SA, Saunders KO, Tomaras GD. 2011. CD8(+)T-cell-mediated control of HIV-1 and SIV infection. Immunol. Res. 49:135–146 - PMC - PubMed
    1. McDermott AB, Koup RA. 2012. CD8(+) T cells in preventing HIV infection and disease. AIDS 26:1281–1292 - PubMed
    1. Cohen MS, Shaw GM, McMichael AJ, Haynes BF. 2011. Acute HIV-1 infection. N. Engl. J. Med. 364:1943–1954 - PMC - PubMed
    1. Borrow P, Lewicki H, Wei X, Horwitz MS, Peffer N, Meyers H, Nelson JA, Gairin JE, Hahn BH, Oldstone MB, Shaw GM. 1997. Antiviral pressure exerted by HIV-1-specific cytotoxic T lymphocytes (CTLs) during primary infection demonstrated by rapid selection of CTL escape virus. Nat. Med. 3:205–211 - PubMed

Publication types

MeSH terms

Substances