

Acute diarrheal syndromic surveillance: effects of weather and holidays
- PMID: 23616829
- PMCID: PMC3632277
- DOI: 10.4338/ACI-2009-12-RA-0024
Acute diarrheal syndromic surveillance: effects of weather and holidays
Abstract
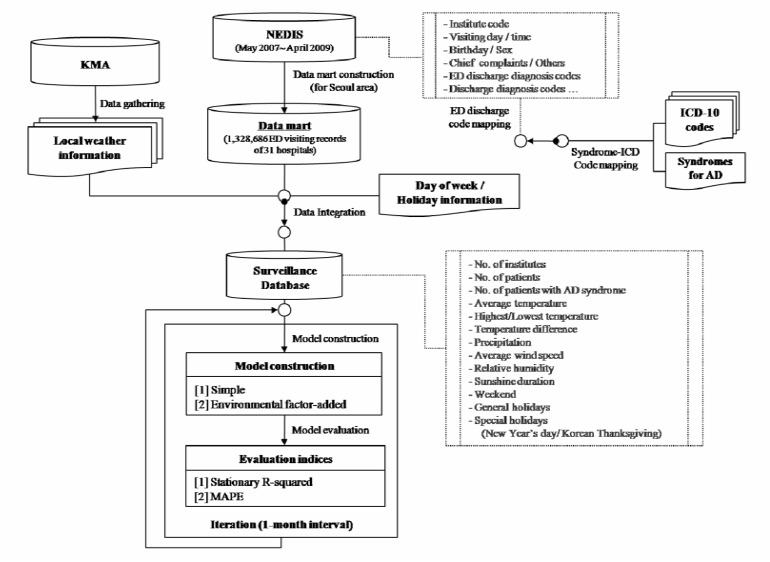
Objective: In an effort to identify and characterize the environmental factors that affect the number of patients with acute diarrheal (AD) syndrome, we developed and tested two regional surveillance models including holiday and weather information in addition to visitor records, at emergency medical facilities in the Seoul metropolitan area of Korea.
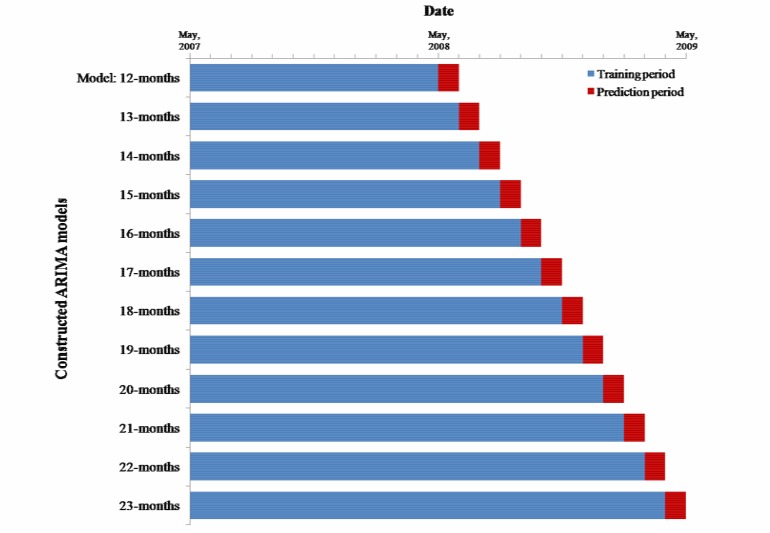
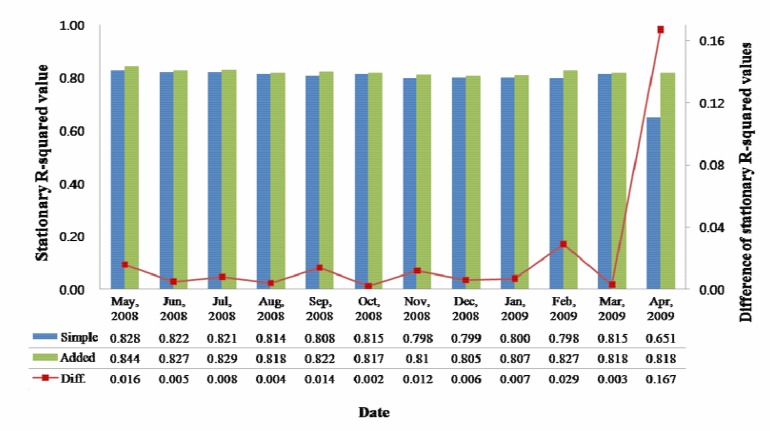
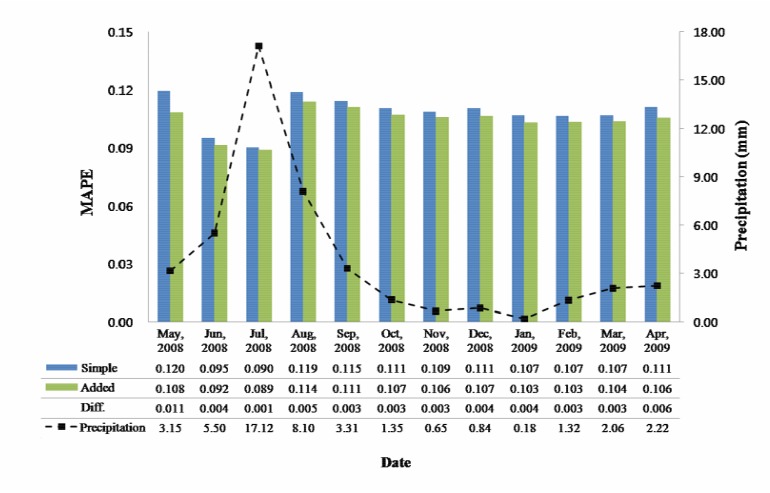
Methods: With 1,328,686 emergency department visitor records from the National Emergency Department Information system (NEDIS) and the holiday and weather information, two seasonal ARIMA models were constructed: (1) The simple model (only with total patient number), (2) the environmental factor-added model. The stationary R-squared was utilized as an in-sample model goodness-of-fit statistic for the constructed models, and the cumulative mean of the Mean Absolute Percentage Error (MAPE) was used to measure post-sample forecast accuracy over the next 1 month.
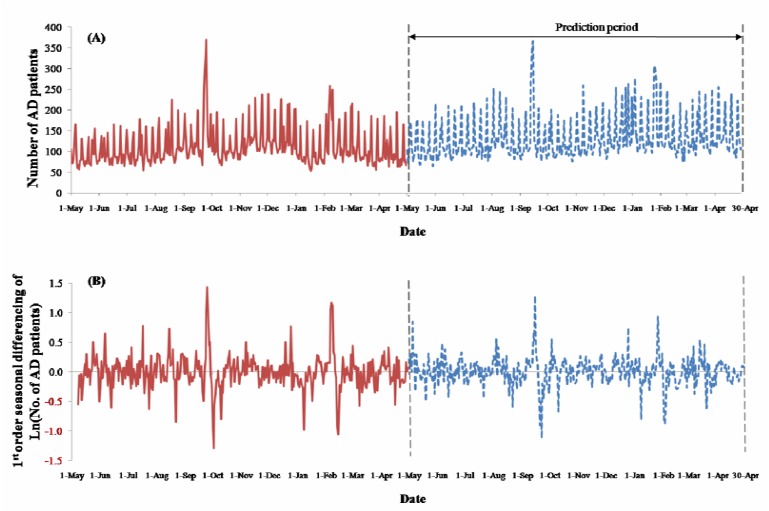
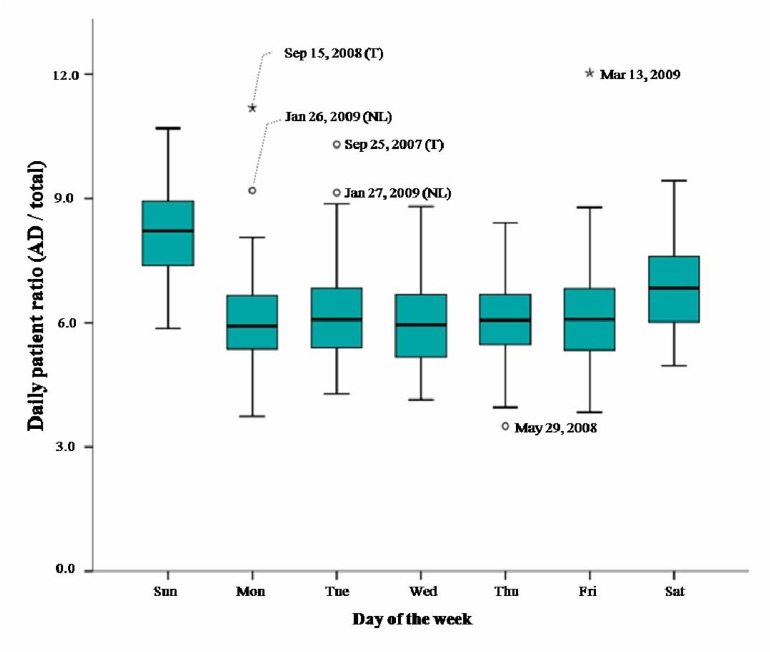
Results: The (1,0,1)(0,1,1)7 ARIMA model resulted in an adequate model fit for the daily number of AD patient visits over 12 months for both cases. Among various features, the total number of patient visits was selected as a commonly influential independent variable. Additionally, for the environmental factor-added model, holidays and daily precipitation were selected as features that statistically significantly affected model fitting. Stationary R-squared values were changed in a range of 0.651-0.828 (simple), and 0.805-0.844 (environmental factor-added) with p<0.05. In terms of prediction, the MAPE values changed within 0.090-0.120 and 0.089-0.114, respectively.
Conclusion: The environmental factor-added model yielded better MAPE values. Holiday and weather information appear to be crucial for the construction of an accurate syndromic surveillance model for AD, in addition to the visitor and assessment records.
Keywords: Surveillance; diarrhea; emergency service hospital; environment; forecasting.
Figures
Similar articles
-
Forecasting respiratory infectious outbreaks using ED-based syndromic surveillance for febrile ED visits in a Metropolitan City.Am J Emerg Med. 2019 Feb;37(2):183-188. doi: 10.1016/j.ajem.2018.05.007. Epub 2018 May 10. Am J Emerg Med. 2019. PMID: 29779674 Free PMC article.
-
Forecasting Hospital Visits Due to Influenza Based on Emergency Department Visits for Fever: A Feasibility Study on Emergency Department-Based Syndromic Surveillance.Int J Environ Res Public Health. 2022 Oct 10;19(19):12954. doi: 10.3390/ijerph191912954. Int J Environ Res Public Health. 2022. PMID: 36232253 Free PMC article.
-
Predicting daily emergency department visits using machine learning could increase accuracy.Am J Emerg Med. 2023 Mar;65:5-11. doi: 10.1016/j.ajem.2022.12.019. Epub 2022 Dec 21. Am J Emerg Med. 2023. PMID: 36574748
-
Application of time series analysis in modelling and forecasting emergency department visits in a medical centre in Southern Taiwan.BMJ Open. 2017 Dec 1;7(11):e018628. doi: 10.1136/bmjopen-2017-018628. BMJ Open. 2017. PMID: 29196487 Free PMC article.
-
Prediction of Daily Patient Numbers for a Regional Emergency Medical Center using Time Series Analysis.Healthc Inform Res. 2010 Sep;16(3):158-65. doi: 10.4258/hir.2010.16.3.158. Epub 2010 Sep 30. Healthc Inform Res. 2010. PMID: 21818435 Free PMC article.
References
-
- Henning KJ. What is syndromic surveillance? MMWR Morb Mortal Wkly Rep. 2004; 53(Suppl.): 5-11 - PubMed
-
- Green MS, Kaufman Z. Surveillance for early detection and monitoring of infectious disease outbreaks associated with bioterrorism. Isr Med Assoc J. 2002; 4(7): 503-506 - PubMed
-
- Cho JP, Min YG, Choi SC. Syndromic surveillances based on the emergency department. J Prev Med Public Health. 2008; 41(4): 219-224 - PubMed
LinkOut - more resources
Full Text Sources
