. 2013 Feb 14;2(4):379-86.
doi: 10.1242/bio.20133079. Print 2013 Apr 15.

Basal aurora kinase B activity is sufficient for histone H3 phosphorylation in prophase

Affiliations

Basal aurora kinase B activity is sufficient for histone H3 phosphorylation in prophase

Ly-Thuy-Tram Le et al. Biol Open. .

Abstract

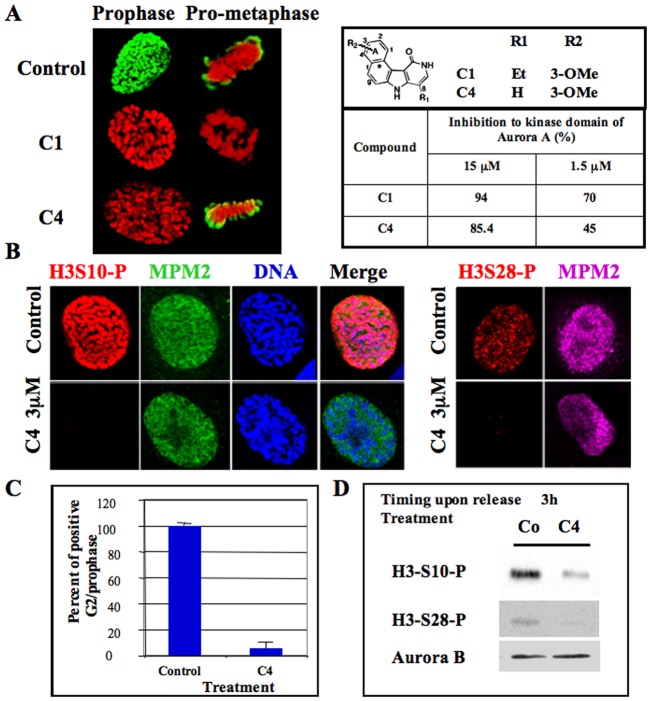
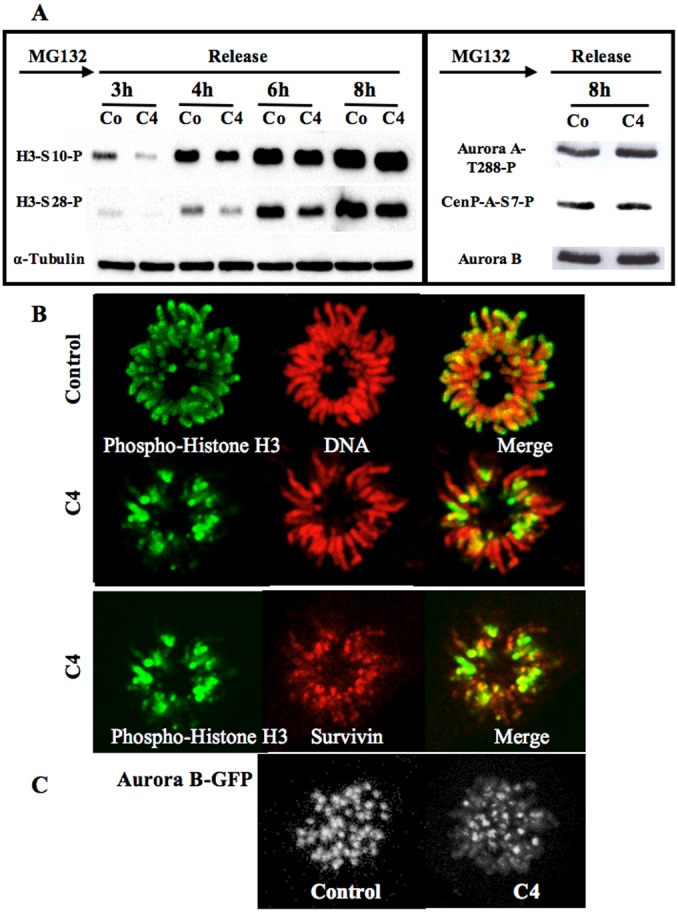
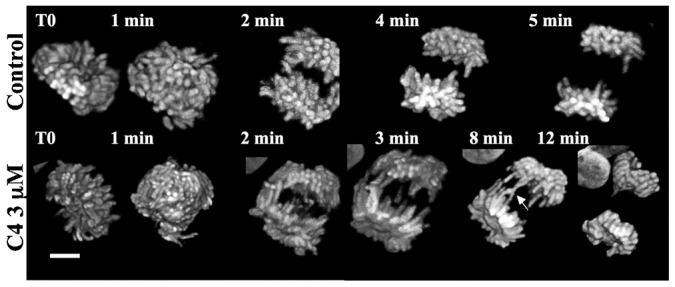
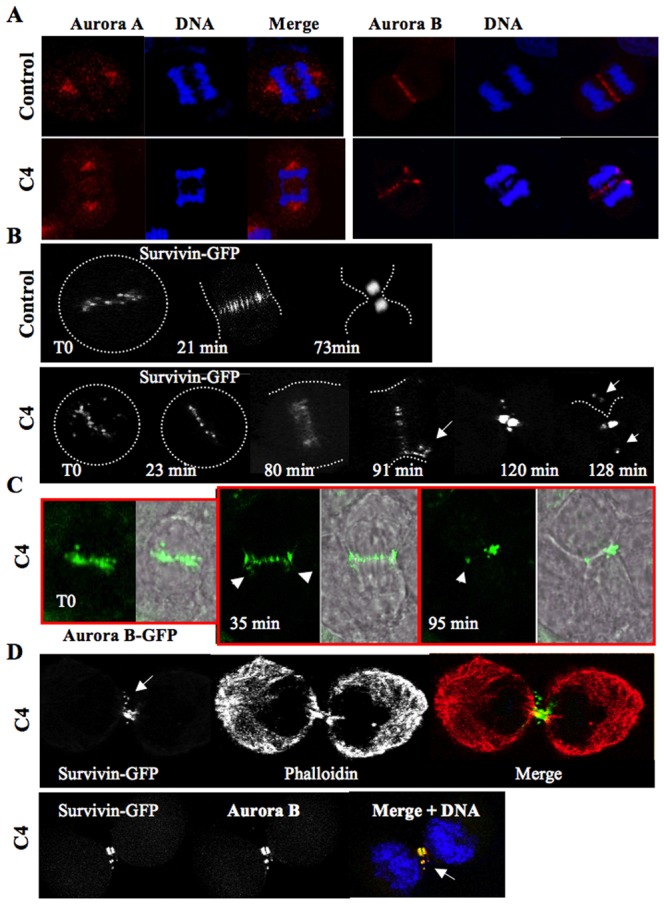
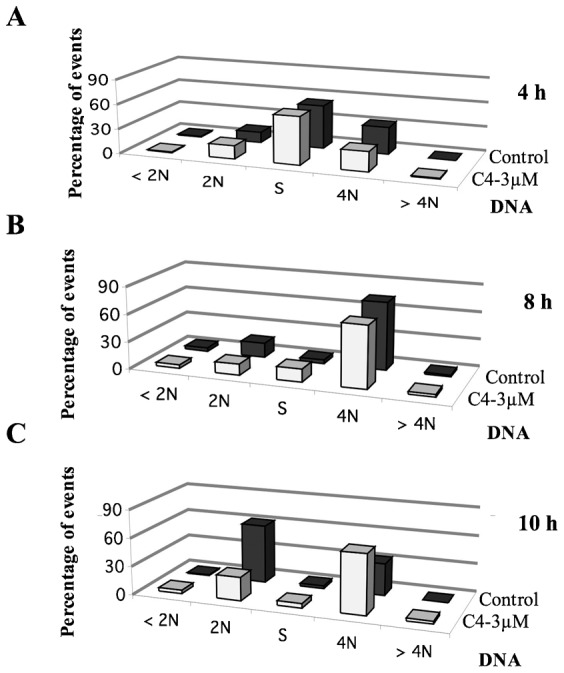
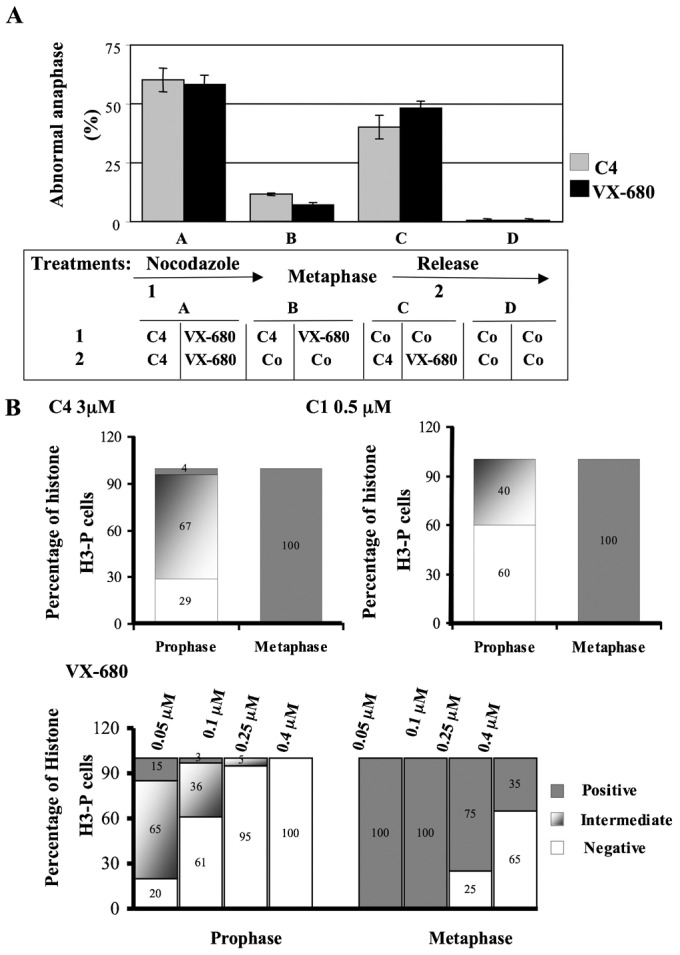
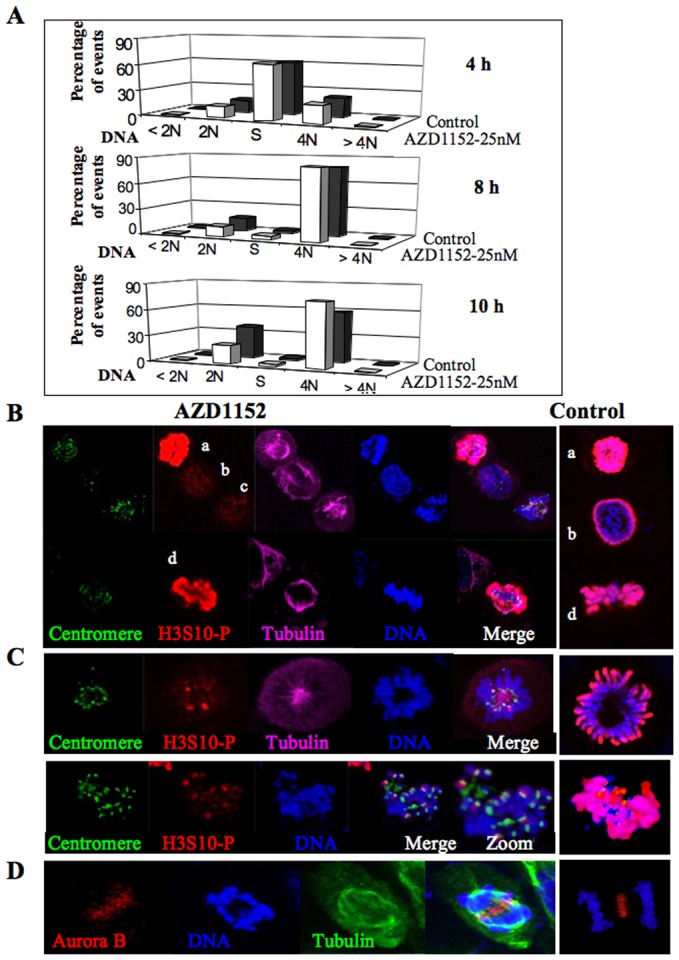
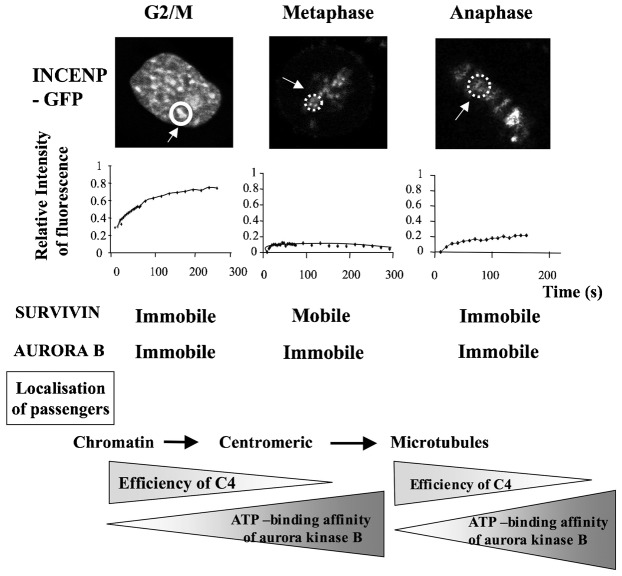
Histone H3 phosphorylation is the hallmark of mitosis deposited by aurora kinase B. Benzo[e]pyridoindoles are a family of potent, broad, ATP-competitive aurora kinase inhibitors. However, benzo[e]pyridoindole C4 only inhibits histone H3 phosphorylation in prophase but not in metaphase. Under the C4 treatment, the cells enter into mitosis with dephosphorylated histone H3, assemble chromosomes normally and progress to metaphase, and then to anaphase. C4 also induces lagging chromosome in anaphase but we demonstrated that these chromosome compaction defects are not related to the absence of H3 phosphorylation in prophase. As a result of C4 action, mitosis lasts longer and the cell cycle is slowed down. We reproduced the mitotic defects with reduced concentrations of potent pan aurora kinase as well as with a specific aurora B ATP-competitive inhibitor; we therefore propose that histone H3 phosphorylation and anaphase chromosome compaction involve the basal activity of aurora kinase B. Our data suggest that aurora kinase B is progressively activated at mitosis entry and at anaphase onset. The full activation of aurora kinase B by its partners, in prometaphase, induces a shift in the catalytic domain of aurora B that modifies its affinity for ATP. These waves of activation/deactivation of aurora B correspond to different conformations of the chromosomal complex revealed by FRAP. The presence of lagging chromosomes may have deleterious consequences on the daughter cells and, unfortunately, the situation may be encountered in patients receiving treatment with aurora kinase inhibitors.

Keywords: Aurora kinase; Cancer; Chromosomal passenger complex; Chromosome compaction; Histone H3 phosphorylation; Kinase inhibitors; Survivin.


Conflict of interest statement

Competing interests: The authors have no competing interests to declare.

Figures

Fig. 1.
Fig. 1.. Delay of histone H3 phosphorylation at mitotic entry upon C4 treatment.
(A) C1 and C4 are two benzo[e]pyridole inhibitors of the catalytic domain of aurora kinase A (Hoang et al., 2009). Molecules and their efficiency in vitro towards aurora A catalytic domain are recalled (Hoang et al., 2009). These data derived from the high throughput screening performed under non-saturating conditions. In vitro, IC50 of C1 towards aurora A, B are 61 nM and 31 nM respectively (Hoang et al., 2009). Immunofluorescences of histone H3 (Ser10) phosphorylation on HeLa cells treated by either C1 (1 µM) or C4 (3 µM) are represented; Histone H3 (Ser10) phosphorylation is shown in green whereas DNA is in red. Both prophase and pro-metaphase are imaged and compared to control cells. (B) Immunofluorescence of Histone H3 (Ser10 and Ser 28) phosphorylations on MPM2 positive HeLa cells. (C) Analysis of the percentage of positive histone H3-phospho Ser 10 at mitotic entry. Two independent experiments were conducted and 100 cells in G2/prophase scored in each. (D) Western blots were realized on cells synchronized by a MG-132 block and then released for 3 hours. Histone H3 (Ser10 and Ser 28) phosphorylations were analyzed. The same membrane was also revealed using an antibody against aurora kinase B for estimation of the amount of mitotic cells.
Fig. 2.
Fig. 2.. Histone H3 phosphorylation appears at prometaphase upon C4 treatment.
(A) Western blots were realized on cells synchronized at mitotic entry in the presence of MG-132 and then released for varying times. Histone H3 (Ser10 and Ser 28) phosphorylations were analyzed in control (Co) and C4 treated cells (C4). The same membrane was also revealed using an antibody against α-tubulin for estimation of the amount of cells. The signals were quantified and the results are in supplementary material Table S1. The phosphorylations of Cenp-A (Ser 7) and aurora kinase A (Thr 288) are also shown in control (Co) and C4 treated cells (C4). Aurora kinase B detection is used for estimation of the amount of mitotic cells. Its level was quantified using α-tubulin as internal standard (supplementary material Table S1; Fig. S2). (B) Detection of histone H3 (Ser10) phosphorylation on control and C4 treated cells. Phospho-histone H3 is in green and DNA in red. On the same C4-treated cells, the histone H3 (Ser10) phosphorylation signal (in green) colocalized with survivin (represented in red). (C) Detection of aurora kinase B on prometaphasic cells. Z stacks were imaged and 3D-projections are shown. The settings were kept identical for both conditions.
Fig. 3.
Fig. 3.. Time lapse on mitotic cells.
Mitotic Hek stably expressing histone H2A-GFP were continuously imaged. Z stacks were acquired and 3D-projections are shown. The settings were kept identical for all conditions. Representative control and C4 treated cells are shown and elapse times indicated on each image. Scale bar: 5 µm.
Fig. 4.
Fig. 4.. Consequences of chromosome compaction defects.
(A) Localization of aurora kinases A and B by immunofluorescence in control and C4 treated cells. A late anaphase is imaged. (B) Time lapse on mitotic HeLa cells stably expressing survivin-GFP. Time-lapse microscopy of mitotic HeLa cells expressing the survivin-GFP fusion was performed in the absence (Control) or in the presence of C4 (at 3 µM). The compound was added to the cell culture and then mitotic cells were continuously imaged. Representative photos, made at the times indicated, are presented. For a better understatement, the shape of the cells is recalled by a white dotted line on each fluorescent image. Two independent experiments were conducted and at least 15 cells were followed in each. (C) Time lapse on mitotic HeLa cells stably expressing aurora B-GFP. The experiment described in B was reproduced with HeLa cells stably expressing aurora B-GFP. A representative cell is shown and the fluorescent signal is merged with the wide field image. Elapsed times are indicated. (D) Immunofluorescence was realized on HeLa cells expressing survivin-GFP. Cells in cytokinesis were imaged. The cell was labelled with phalloidin-TRITC in order to visualize its shape meanwhile aurora kinase B was revealed with antibodies.
Fig. 5.
Fig. 5.. Cell cycle progression upon C4 treatment.
FACS analyses show the repartition of synchronized HeLa cells treated by either C4, at the concentration of 3 µM, for 4 (A), 8 (B) and 10 (C) hours in comparison to non-treated cells. DNA was stained with propidium iodine and the samples were analyzed with the BD Accuri C6 flow cytometer (BD Biosciences, US). The percentage of cells in the different phases is indicated in supplementary material Table S1.
Fig. 6.
Fig. 6.. Quantification of the mitotic defect induced by C4.
(A) Abnormal anaphases presenting connecting chromosomes were scored by immunofluorescence. DNA was labelled by Hoechst. Cells were synchronized in prometaphase by nocodazole (0.33 µM) for 16 hours and anaphase was induced upon release (post-anaphase onset, 3 hours). Compounds C4 (3 µM) and VX-680 (0.1 µM) were present in different steps: either in (pro)metaphase (1) and (or) post-metaphase (2). In assays A, compounds were added in both steps (1) and (2). In assays B, compounds were only present in prometaphase and were then withdrawn in (2); conversely in assays C, compounds were added after metaphase (step 2). Co means control experiments without compound. Control assays in the absence of compounds are in D. A view of the course of the experiment is shown. Around 200 mitotic cells were analysed in each condition and two independent experiments were conducted. (B) The percentage of phospho-histone H3 (Ser 10) was defined by immunofluorescence, in both prophasic and metaphasic HeLa cells treated either by C4 (3 µM), C1 (0.5 µM) or VX-680 (the concentration of VX-680 varied from 0.05 µM to 0.4 µM). Cells were scored as positive, negative or intermediate. Intermediate signal means a significant reduction of the phosphorylation compared to the control. Around 100 cells were scored in each assay and two independent experiments were conducted.
Fig. 7.
Fig. 7.. Effect of low concentrations of AZD1152.
(A) Cell cycle progression upon AZD1152 treatment FACS analyses show the repartition of synchronized HeLa cells treated by either AZD1152, at the concentration of 25 nM, for 4, 8 and 10 hours in comparison to non-treated cells. DNA was stained with propidium iodide and the samples were analyzed with the BD Accuri C6 flow cytometer (BD Biosciences, US). (B) Immunofluorescence of HeLa cells treated by AZD1152, for 15 hours, at the concentration of 25 nM. Centromeres are revealed in green, histone H3(S10) phosphorylation (H3S10-P) is in red, α-tubulin in far red and DNA in blue. Control cells are shown on the right, H3(S10) phosphorylation (H3S10-P) is in red and DNA in blue. Cells a and d are in metaphase, b in prophase and c in prometaphase. (C) Same experiments as in B. Centromeres are detected by a specific antibody and represented in green. Two different prometaphasic cells are imaged. For an easy visualisation of the colocalization, an enlarged merge is shown in one case. Control cells are shown on the right, H3(S10) phosphorylation (H3S10-P) is in red and DNA in blue. (D) Cells were synchronized by nocodazole and imaged 3 hours after release. Most of the cells in anaphase (around 30%) present compaction defects. Aurora kinase B is revealed in red, DNA in blue, α-tubulin in green. A control cell is shown on the right, aurora kinase B is in red, DNA in blue.
Fig. 8.
Fig. 8.. Compared mobilities of passenger proteins in G2/M-prophase, metaphase and anaphase.
FRAP experiments were performed on HeLa cells stably expressing GFP-INCENP or survivin-GFP or aurora kinase B-GFP. The bleached zone is indicated by the dotted line. The recovery of fluorescence was registered at the times indicated and expressed as relative intensities. The kinetics of recovery are shown on the right side of the cell images. Time is in seconds. Survivin and aurora recovering are already published (Delacour-Larose et al., 2004; Delacour-Larose et al., 2007) and recalled in the figure for comparison. The localization of passenger proteins during mitosis progression is indicated as well as the timing of efficiency of C4 (from G2/M to prometaphase and at anaphase onset). The proposed variations of aurora kinase B affinity for ATP are visualized with arrows.

Similar articles

Cited by

References

    1. Adams R. R., Maiato H., Earnshaw W. C., Carmena M. (2001). Essential roles of Drosophila inner centromere protein (INCENP) and Aurora B in histone H3 phosphorylation, metaphase chromosome alignment, kinetochore disjunction, and chromosome segregation. J. Cell Biol. 153, 865–880 10.1083/jcb.153.4.865 - DOI - PMC - PubMed
    1. Baek S. H. (2011). When signaling kinases meet histones and histone modifiers in the nucleus. Mol. Cell 42, 274–284 10.1016/j.molcel.2011.03.022 - DOI - PubMed
    1. Carmena M., Ruchaud S., Earnshaw W. C. (2009). Making the Auroras glow: regulation of Aurora A and B kinase function by interacting proteins. Curr. Opin. Cell Biol. 21, 796–805 10.1016/j.ceb.2009.09.008 - DOI - PMC - PubMed
    1. Cheetham G. M. T., Charlton P. A., Golec J. M. C., Pollard J. R. (2007). Structural basis for potent inhibition of the Aurora kinases and a T315I multi-drug resistant mutant form of Abl kinase by VX-680. Cancer Lett. 251, 323–329 10.1016/j.canlet.2006.12.004 - DOI - PubMed
    1. de la Barre A.–E., Angelov D., Molla A., Dimitrov S. (2001). The N-terminus of histone H2B, but not that of histone H3 or its phosphorylation, is essential for chromosome condensation. EMBO J. 20, 6383–6393 10.1093/emboj/20.22.6383 - DOI - PMC - PubMed