. 2013 Mar 22;2(4):387-95.
doi: 10.1242/bio.20133269. Print 2013 Apr 15.

Moderate excess of pyruvate augments osteoclastogenesis

Affiliations

Moderate excess of pyruvate augments osteoclastogenesis

Jenna E Fong et al. Biol Open. .

Abstract

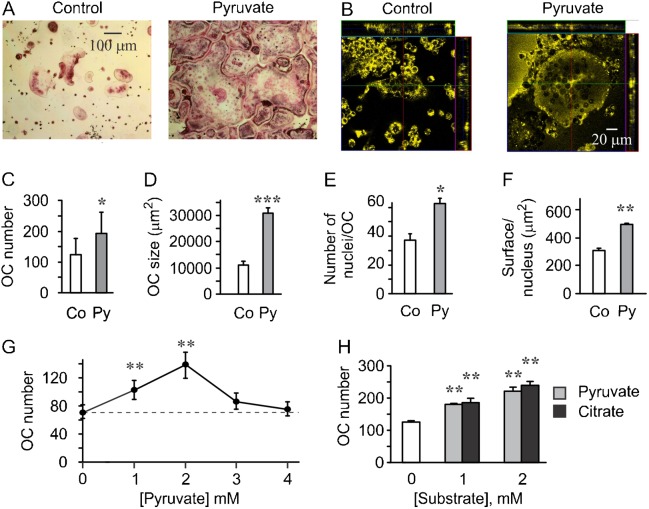
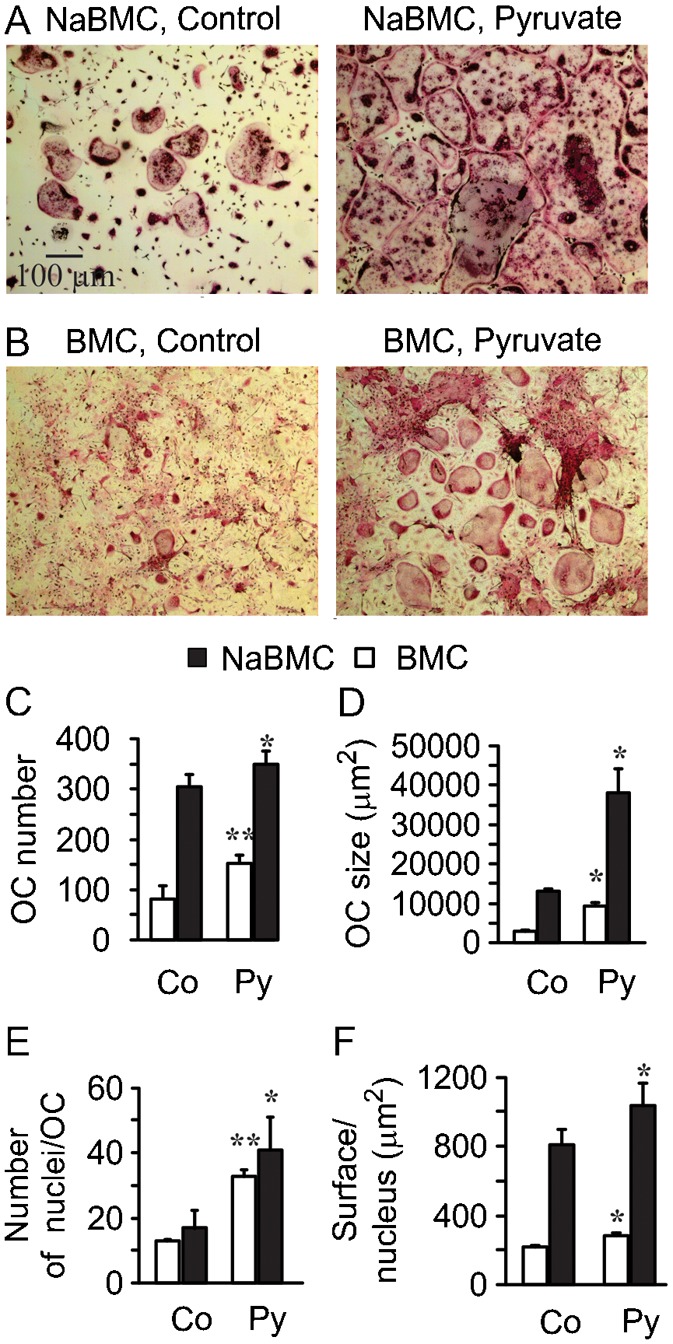
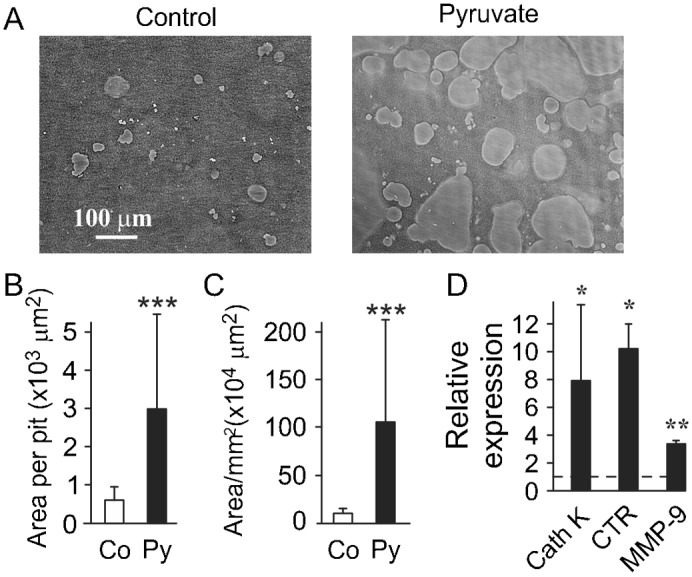
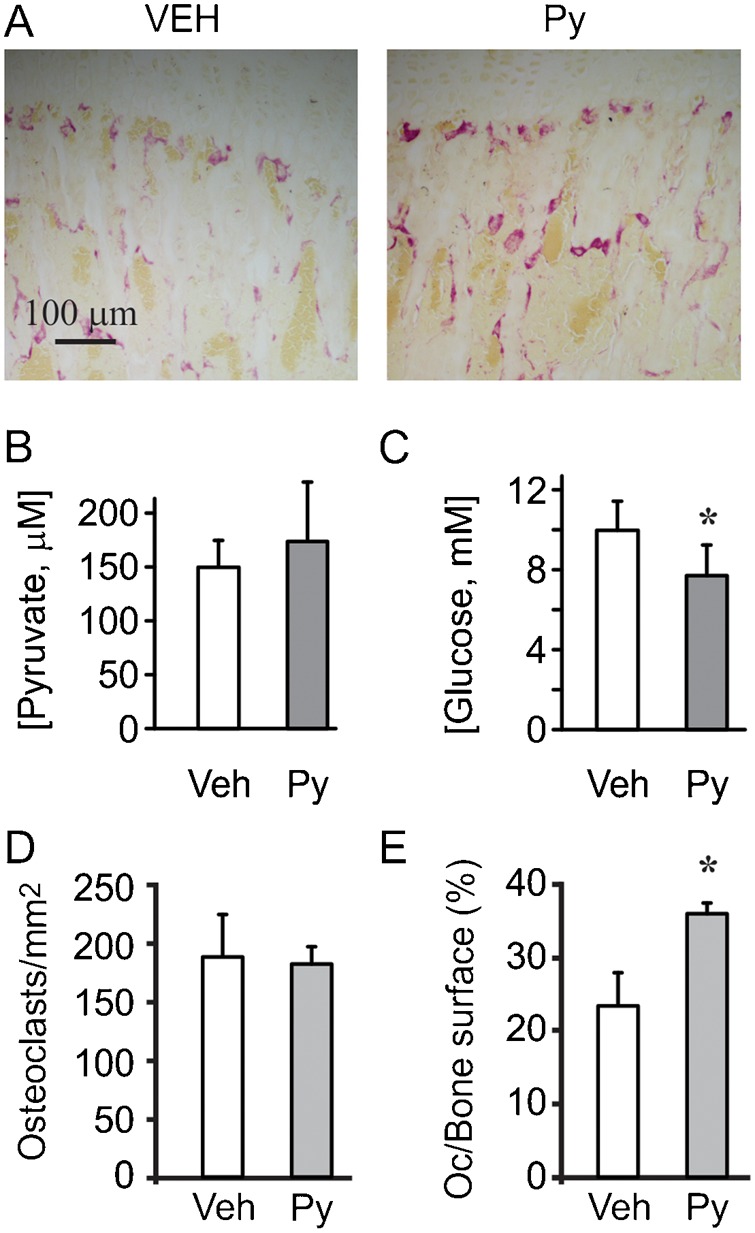
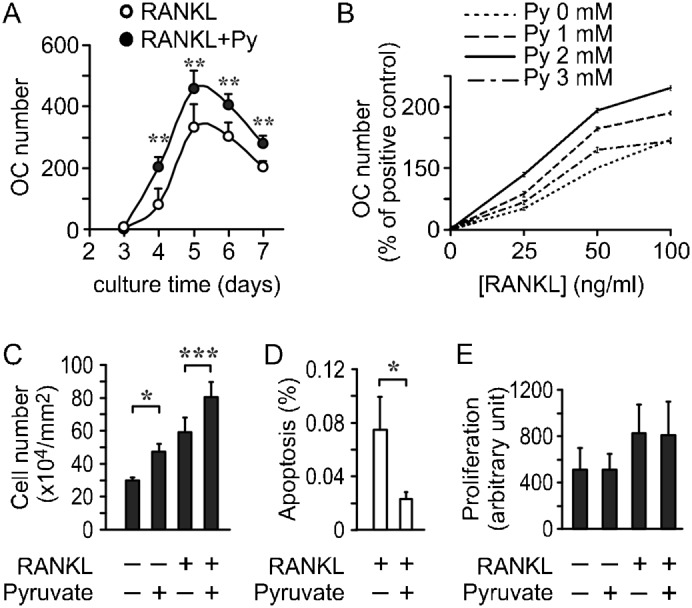
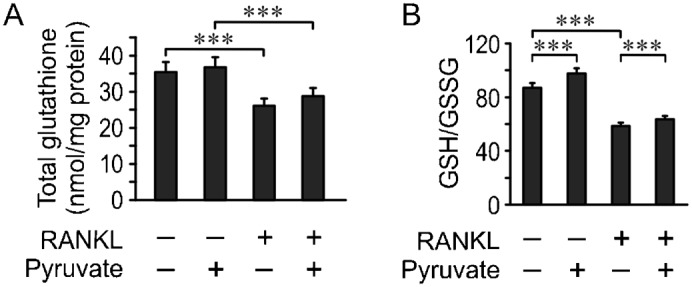
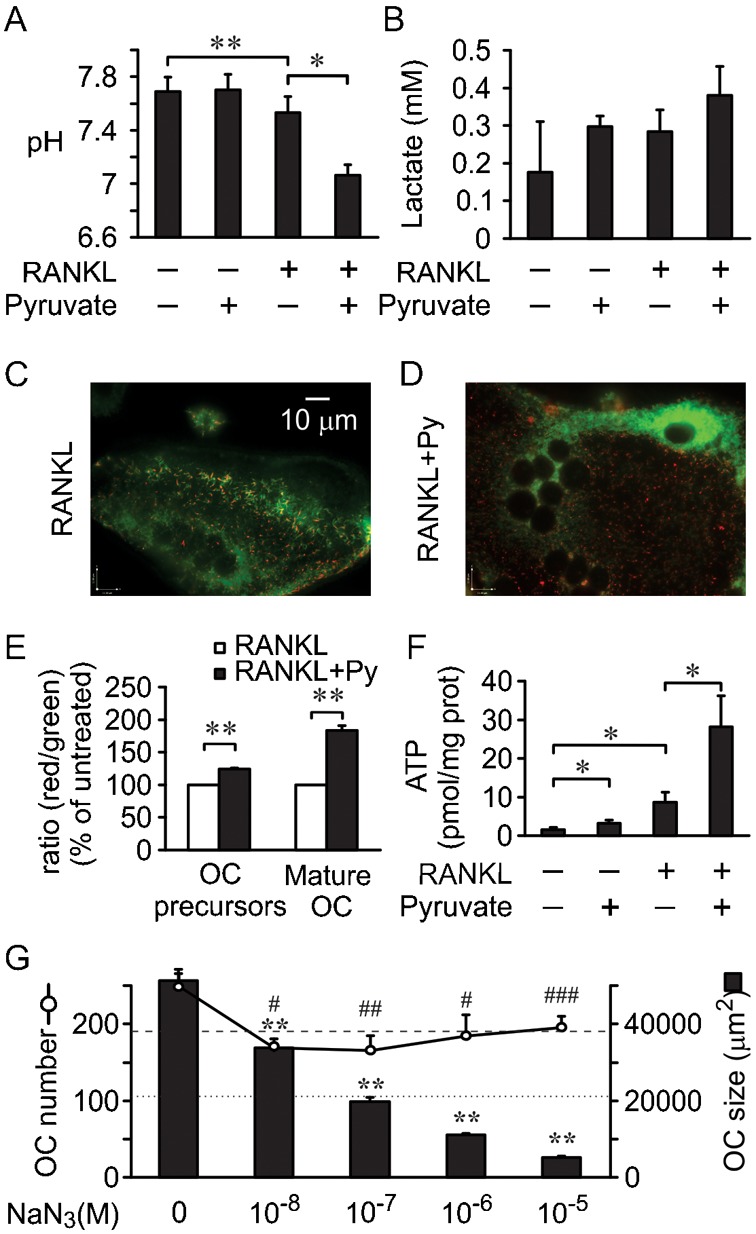
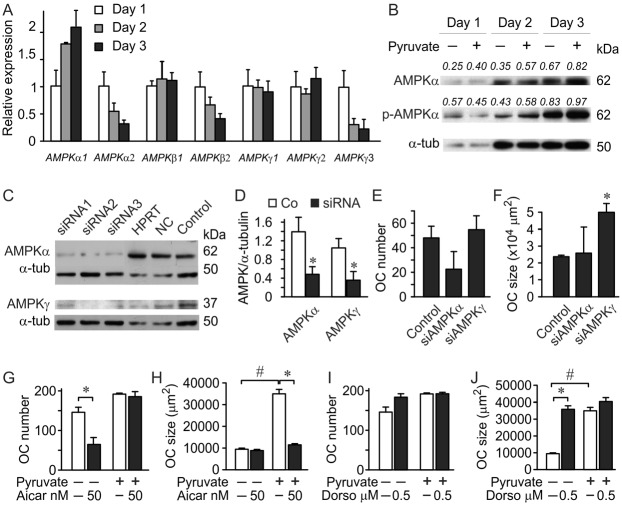
Cell differentiation leads to adaptive changes in energy metabolism. Conversely, hyperglycemia induces malfunction of many body systems, including bone, suggesting that energy metabolism reciprocally affects cell differentiation. We investigated how the differentiation of bone-resorbing osteoclasts, large polykaryons formed through fusion and growth of cells of monocytic origin, is affected by excess of energy substrate pyruvate and how energy metabolism changes during osteoclast differentiation. Surprisingly, small increases in pyruvate (1-2 mM above basal levels) augmented osteoclastogenesis in vitro and in vivo, while larger increases were not effective in vitro. Osteoclast differentiation increased cell mitochondrial activity and ATP levels, which were further augmented in energy-rich conditions. Conversely, the inhibition of respiration significantly reduced osteoclast number and size. AMP-activated protein kinase (AMPK) acts as a metabolic sensor, which is inhibited in energy-rich conditions. We found that osteoclast differentiation was associated with an increase in AMPK levels and a change in AMPK isoform composition. Increased osteoclast size induced by pyruvate (1 mM above basal levels) was prevented in the presence of AMPK activator 5-amino-4-imidazole carboxamide ribonucleotide (AICAR). In keeping, inhibition of AMPK using dorsomorphin or siRNA to AMPKγ increased osteoclast size in control cultures to the level observed in the presence of pyruvate. Thus, we have found that a moderate excess of pyruvate enhances osteoclastogenesis, and that AMPK acts to tailor osteoclastogenesis to a cell's bioenergetics capacity.

Keywords: AMPK; ATP; Hyperglycemia; Osteoclastogenesis; Pyruvate.


Conflict of interest statement

Competing interests: The authors have no competing interests to declare.

Figures

Fig. 1.
Fig. 1.. Osteoclast differentiation from RAW 264.7 cells is augmented by excess in pyruvate.
(A–F) RAW 264.7 cells were cultured in supplemented DMEM containing 25 mM basal glucose and treated with RANKL (50 ng/ml) for 4 days in the absence or presence of pyruvate (Py, 1 mM). (A) Representative images of osteoclasts generated in control cultures and in pyruvate-treated cultures. Scale bar: 100 µm applies to both images. (B) Confocal images of osteoclasts generated from RAW 264.7 cells in the absence or presence of pyruvate and stained with lipophilic membrane probe DiI. Scale bar: 20 µm applies to both images. (C) Average number of osteoclasts formed in control and pyruvate-treated cultures. (D) Average osteoclast surface area. (E) Average number of nuclei per osteoclast. (F) Average surface area per nucleus. For C–F, data are means ± s.e.m.; n = 6 independent experiments. Statistical significance compared to control was assessed by paired t-test, *P<0.05; **P<0.01; ***P<0.001. (G) RAW 264.7 cells were cultured with RANKL (50 ng/ml) for 4 days without additions (untreated, dashed line) or in the presence of pyruvate (1–4 mM) and osteoclast numbers were assessed. Data are means ± s.e.m.; n = 8 independent experiments; **P<0.01 was assessed by ANOVA for correlated samples followed by Tukey post-test. (H) RAW 264.7 cells were cultured with RANKL (50 ng/ml) for 4 days without additions (open bar) or in the presence of 1–2 mM of pyruvate (gray bars) or citrate (black bars) and osteoclast numbers were assessed. Data are means ± s.e.m.; n = 3 independent experiments, **P<0.01 was assessed by ANOVA for correlated samples followed by Tukey post-test.
Fig. 2.
Fig. 2.. Osteoclast differentiation from bone marrow cells is augmented by pyruvate.
(A) Representative images of non-adherent bone marrow cells cultured in supplemented α-MEM containing 5 mM basal glucose and 1 mM basal pyruvate with RANKL (100 ng/ml) and M-CSF (50 ng/ml) for 4 days (NaBMC) without (Control) or with additional pyruvate (1 mM). Scale bar: 100 μm applies to all images. (B) Representative images of mouse bone marrow cells cultured in supplemented MEM containing 5 mM basal glucose with AA (50 µg/ml) and RANKL (50 ng/m) for 4 days (BMC) without (Control) or with pyruvate (1 mM). (C) Average number of osteoclasts formed in control or pyruvate-treated NaBMC (black bars) and BMC (white bars) cultures. (D) Average osteoclast surface area. (E) Average number of nuclei per osteoclast. (F) Average surface area per nucleus. For C–F, data are means ± s.e.m.; n = 3 independent experiments for NaBMC, n = 4 for BMC, *P<0.05; **P<0.01 compared to samples cultured at standard conditions was assessed by paired t-test.
Fig. 3.
Fig. 3.. Osteoclasts formed in the presence of pyruvate exhibit higher resorptive activity.
(A–C) RAW 264.7 cells were plated on calcium phosphate and cultured for 10 days with RANKL (50 ng/ml) without or with pyruvate (1 mM, Py). (A) Representative images of resorption pits in control cultures (left) and cultures treated with pyruvate (right). Scale bar: 100 μm applies to both images. (B) Average area of a single resorption pit. (C) Average total resorption area per 1 mm2 of substrate. Data are means ± s.d., n = 20 fields per condition, ***P<0.001 indicates significance assessed by t-test. (D) Non-adherent bone marrow cells were treated with RANKL (100 ng/ml) and M-CSF (50 ng/ml) for 4 days in the presence or absence of pyruvate, and the expression of cathepsin K (CathK), calcitonin receptor (CTR) and MMP-9 was assessed. Data are means ± s.e.m., n = 3–6 independent experiments, *P<0.05; **P<0.01; indicate significance assessed by t-test.
Fig. 4.
Fig. 4.. Pyruvate augments osteoclastogenesis in vivo.
Mice were injected for 7 days with pyruvate (0.75 g/kg/day). Osteoclast number and surface were assessed on paraffin-embedded sections from proximal tibiae. (A) Representative images of osteoclasts in vehicle-treated (left), and pyruvate-treated (right) bones. Scale bar: 100 μm applies to both images. (B,C) Basal blood levels of pyruvate (B) and glucose (C) in mice injected with vehicle or pyruvate. Data are means ± s.d., n = 6 animals per condition, statistical significance was assessed by t-test, *P<0.05. (D) Average number of osteoclasts per mm2. (E) Average osteoclast surface per bone surface. Data are means ± s.e.m., n = 3 animals (3 sections/animal), statistical significance was assessed by t-test, *P<0.05.
Fig. 5.
Fig. 5.. Effect of pyruvate on osteoclast precursors.
(A) RAW 264.7 cells were cultured with RANKL, without (white circles) or with pyruvate (1 mM, black circles) and osteoclast numbers formed on days 3–7 were assessed. Data are means ± s.e.m., n = 3–5 independent experiments, **P<0.01 indicates significance for the effect of pyruvate assessed by two-way ANOVA, which indicated significant influence of both time and pyruvate treatment. (B) Effect of pyruvate on osteoclast formation was pyruvate concentration- and RANKL concentration-dependent. For each pyruvate concentration (Py, 0, 1, 2 and 3 mM), RAW 264.7 cells were treated with 0, 25, 50 or 100 ng/ml of RANKL for 4 days. Osteoclast number was assessed for each condition and normalized to number of osteoclasts formed with 50 ng/ml of RANKL without pyruvate. (C,D) RAW 264.7 cells were cultured for 2 days with RANKL, without or with pyruvate, and the samples were fixed and stained with DAPI. The number of pre-osteoclasts (C) and the proportion of cells exhibiting nuclear fragmentation (D) were assessed. Data are means ± s.e.m., n = 3 independent experiments, *P<0.05; ***P<0.001 indicate significance assessed by t-test. (E) RAW 264.7 cells were cultured for 4 days with or without RANKL and in the absence or presence of pyruvate (1 mM). BrdU incorporation was assessed in each condition. Data are means ± s.e.m. of n = 6 independent experiments, no statistically significant difference.
Fig. 6.
Fig. 6.. Effect of pyruvate on osteoclast redox status.
RAW 264.7 cells were cultured for 4 days with or without RANKL and in the absence or presence of pyruvate (1 mM). Total glutathione (GSH+GSSG) levels (A) and GSH/GSSG ratio (B) were assessed. Data are means ± s.e.m., n = 5 independent experiments, ***P<0.001 indicates significance assessed by t-test.
Fig. 7.
Fig. 7.. Effect of pyruvate on osteoclast energy metabolism.
RAW 264.7 cells were cultured for 2 days (OC precursors) or 4 days (mature OC) with or without RANKL and with or without pyruvate (1 mM). (A,B) Media pH (A), and lactate concentration (B) were assessed. Data are means ± s.e.m., n = 3 independent experiments, *P<0.05; **P<0.01 indicate significance assessed by paired t-test. (C,D) Representative images of mitochondria stained with the vital mitochondrial dye JC-1 in osteoclasts formed in the presence of RANKL alone (C) or RANKL and pyruvate (D). Scale bar: 10 µm applies to both images. (E) Mitochondrial transmembrane potential Δψm (indicated by red to green intensity ratios of JC-1) normalized to the ratio obtained in cultures treated with RANKL only. Data are means ± s.e.m., n = 3 independent experiments, **P<0.01 indicates significance assessed by t-test. (F) Intracellular ATP concentration. Data are means ± s.e.m., n = 4 independent experiments, *P<0.05 indicates significance assessed by paired t-test. (G) RAW 264.7 cells were cultured with RANKL and pyruvate in the presence of increasing concentration of NaN3, and osteoclast number and size were assessed. Dashed line indicates osteoclast number and dotted line indicates osteoclast size in cultures treated with RANKL only. Data are means ± s.e.m., n = 3 independent experiments, *indicates significance for cell size and #for cell numbers, compared to samples cultured without NaN3, iP<0.05; iiP<0.01; iiiP<0.001 indicate significance assessed by ANOVA.
Fig. 8.
Fig. 8.. AMPK pathway mediates pyruvate effects on osteoclast size.
(A) Non-adherent bone marrow cells were treated with MCSF (50 mg/ml) and RANKL (100 ng/ml) and RNA extracts were collected on day 1, 2 and 3 after induction of differentiation. Expression of AMPKα, β and γ isoforms was normalized to the expression of GAPDH and presented relative to the level of each isoform on day 1. Data are means ± s.d., n = 3 replicates. (B) RAW 264.7 cells were treated for 3 days with RANKL (50 ng/ml), with or without pyruvate (1 mM), cell lysates were collected and phospho-AMPKα, and AMPKα, were assessed by immunoblotting; α-tubulin was used as a loading control. The blot was first probed for phospho-AMPKα, stripped and then blotted for total AMPKα. The number above the blot indicates the ratio of protein levels relative to α-tubulin for AMPKα or relative to total AMPKα for phospho-AMPKα. (C–F) siRNA (10 nM) against AMPKα (3 different oligonucleotides) or AMPKγ (3 different oligonucleotides), a universal double scrambled negative control (NC) and a HPRT control were transiently transfected into RAW 264.7 cells, which were then treated for 4 days with RANKL (50 ng/ml) in the absence of pyruvate. (C) Cell lysates were collected from untransfected osteoclasts generated from RAW 264.7 cells (control), or from osteoclasts transfected with indicated oligonucleotides, and immunoblotted on the same membrane for AMPKα (top), or AMPKγ (bottom), α-tubulin was used as a loading control and is the same for control samples blotted for AMPKα and AMPKγ. Shown are data from one of two independent experiments, (D) average protein levels of AMPKα and AMPKγ in control samples (open bars) and samples treated with corresponding siRNA (black bars). Data are means ± s.d., n = 3 samples treated with different oligonucleotides, *P<0.05 indicates significance assessed by t-test. (E,F) Effect of siRNAs for AMPKα or AMPKγ on the osteoclasts number (E) and size (F) were assessed. Data are means ± s.d., n = 3 samples treated with different oligonucleotides for osteoclast numbers, n = 47–148 cells for osteoclast size, shown are data from one of two independent experiments, *P<0.05 indicates significance assessed by t-test. (G,H) RAW 264.7 cells were treated for 4 days with RANKL, with or without pyruvate (1 mM), and in the absence or presence of AMPK activator AICAR (50 nM), and osteoclast number (G) and size (H) were assessed. Data are means ± s.e.m., n = 3 independent experiments, *P<0.05 compared to without AICAR; #P<0.01 compared to without pyruvate indicate significance assessed by paired t-test. (I,J) RAW 264.7 cells were treated for 4 days with RANKL, with or without pyruvate (1 mM), and in the absence or presence of AMPK inhibitor dorsomorphin (Dorso, 0.5 µM), and osteoclast number (I) and size (J) were assessed. Data are means ± s.e.m., n = 3 independent experiments, *P<0.05 compared to without dorsomorphin; #P<0.01 compared to without pyruvate indicate significance assessed by paired t-test.

Similar articles

Cited by

References

    1. Ataullakhanov F. I., Vitvitsky V. M. (2002). What determines the intracellular ATP concentration. Biosci. Rep. 22, 501–511 10.1023/A:1022069718709 - DOI - PubMed
    1. Atkinson D. E. (1968). The energy charge of the adenylate pool as a regulatory parameter. Interaction with feedback modifiers. Biochemistry 7, 4030–4034 10.1021/bi00851a033 - DOI - PubMed
    1. Barnerias C., Saudubray J. M., Touati G., De Lonlay P., Dulac O., Ponsot G., Marsac C., Brivet M., Desguerre I. (2010). Pyruvate dehydrogenase complex deficiency: four neurological phenotypes with differing pathogenesis. Dev. Med. Child Neurol. 52, e1–e9 10.1111/j.1469-8749.2009.03541.x - DOI - PubMed
    1. Bassenge E., Sommer O., Schwemmer M., Bünger R. (2000). Antioxidant pyruvate inhibits cardiac formation of reactive oxygen species through changes in redox state. Am. J. Physiol. 279, H2431–H2438. - PubMed
    1. Czupalla C., Mansukoski H., Pursche T., Krause E., Hoflack B. (2005). Comparative study of protein and mRNA expression during osteoclastogenesis. Proteomics 5, 3868–3875 10.1002/pmic.200402059 - DOI - PubMed

LinkOut - more resources