

Time series analysis of cholera in Matlab, Bangladesh, during 1988-2001
- PMID: 23617200
- PMCID: PMC3702354
- DOI: 10.3329/jhpn.v31i1.14744
Time series analysis of cholera in Matlab, Bangladesh, during 1988-2001
Abstract
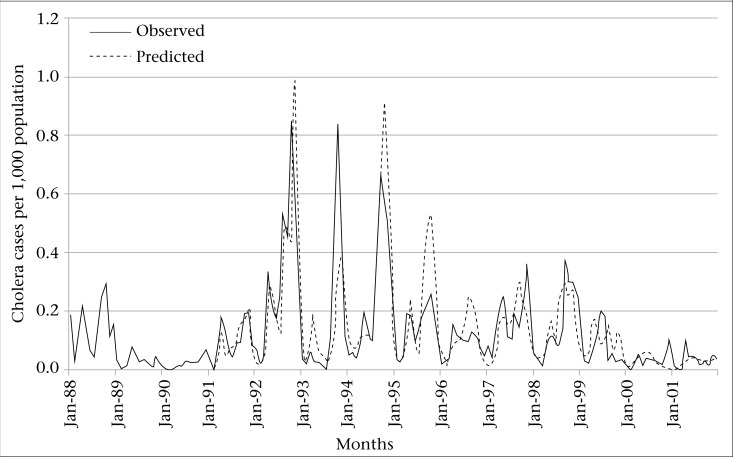
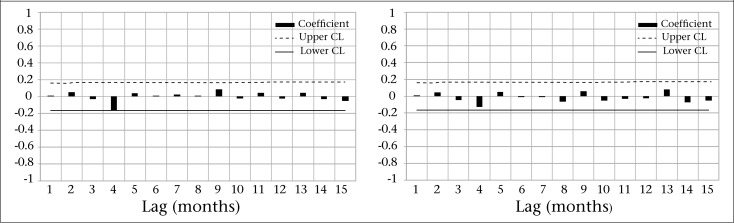
The study examined the impact of in-situ climatic and marine environmental variability on cholera incidence in an endemic area of Bangladesh and developed a forecasting model for understanding the magnitude of incidence. Diarrhoea surveillance data collected between 1988 and 2001 were obtained from a field research site in Matlab, Bangladesh. Cholera cases were defined as Vibrio cholerae O1 isolated from faecal specimens of patients who sought care at treatment centres serving the Matlab population. Cholera incidence for 168 months was correlated with remotely-sensed sea-surface temperature (SST) and in-situ environmental data, including rainfall and ambient temperature. A seasonal autoregressive integrated moving average (SARIMA) model was used for determining the impact of climatic and environmental variability on cholera incidence and evaluating the ability of the model to forecast the magnitude of cholera. There were 4,157 cholera cases during the study period, with an average of 1.4 cases per 1,000 people. Since monthly cholera cases varied significantly by month, it was necessary to stabilize the variance of cholera incidence by computing the natural logarithm to conduct the analysis. The SARIMA model shows temporal clustering of cholera at one- and 12-month lags. There was a 6% increase in cholera incidence with a minimum temperature increase of one degree celsius in the current month. For increase of SST by one degree celsius, there was a 25% increase in the cholera incidence at currrent month and 18% increase in the cholera incidence at two months. Rainfall did not influenc to cause variation in cholera incidence during the study period. The model forecast the fluctuation of cholera incidence in Matlab reasonably well (Root mean square error, RMSE: 0.108). Thus, the ambient and sea-surface temperature-based model could be used in forecasting cholera outbreaks in Matlab.
Figures


References
-
- Colwell RR. Global climate and infectious disease: the cholera paradigm. Science. 1996;274:2025–31. - PubMed
-
- Epstein PR, Ford TE, Colwell RR. Marine ecosystems. Lancet. 1993;342:1216–9. - PubMed
-
- Patz JA, Epstein PR, Burke TA, Balbus JM. Global climate change and emerging infectious diseases. JAMA. 1996;275:217–23. - PubMed
-
- Koelle K, Pascual M. Disentangling extrinsic from intrinsic factors in disease dynamics: a nonlinear time series approach with an application to cholera. Am Nat. 2004;163:901–13. - PubMed
Publication types
MeSH terms
LinkOut - more resources
Full Text Sources
Other Literature Sources
Medical