. 2013 Apr 24:14:138.
doi: 10.1186/1471-2105-14-138.

An efficient algorithm to perform multiple testing in epistasis screening

Affiliations

An efficient algorithm to perform multiple testing in epistasis screening

François Van Lishout et al. BMC Bioinformatics. .

Abstract

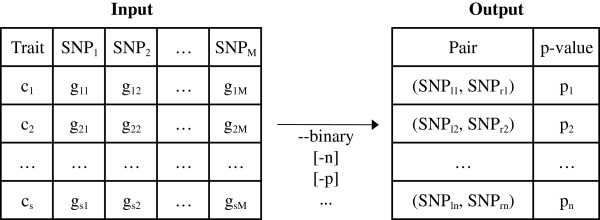
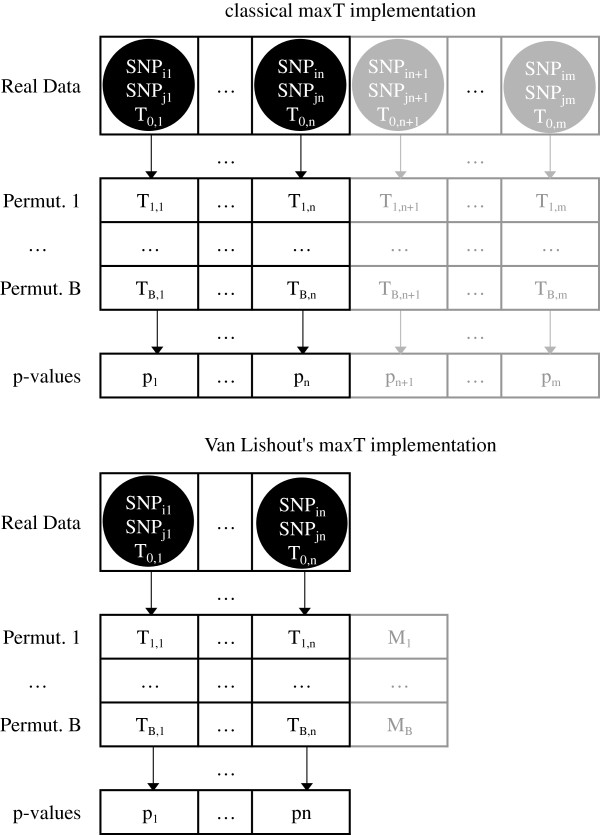
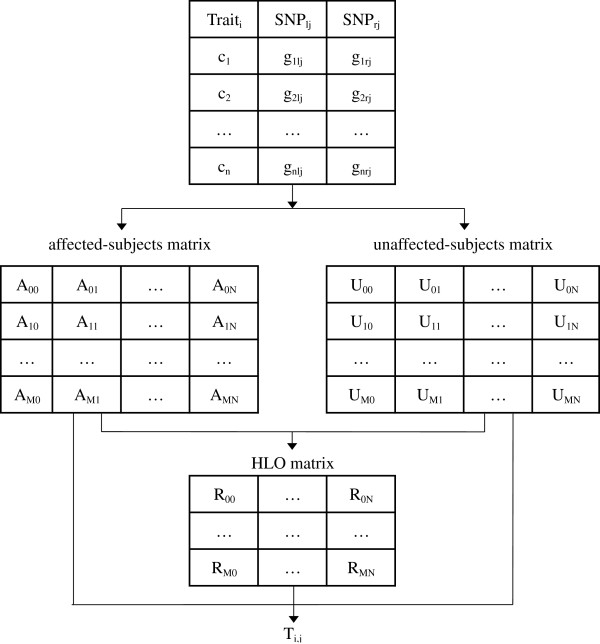
Background: Research in epistasis or gene-gene interaction detection for human complex traits has grown over the last few years. It has been marked by promising methodological developments, improved translation efforts of statistical epistasis to biological epistasis and attempts to integrate different omics information sources into the epistasis screening to enhance power. The quest for gene-gene interactions poses severe multiple-testing problems. In this context, the maxT algorithm is one technique to control the false-positive rate. However, the memory needed by this algorithm rises linearly with the amount of hypothesis tests. Gene-gene interaction studies will require a memory proportional to the squared number of SNPs. A genome-wide epistasis search would therefore require terabytes of memory. Hence, cache problems are likely to occur, increasing the computation time. In this work we present a new version of maxT, requiring an amount of memory independent from the number of genetic effects to be investigated. This algorithm was implemented in C++ in our epistasis screening software MBMDR-3.0.3. We evaluate the new implementation in terms of memory efficiency and speed using simulated data. The software is illustrated on real-life data for Crohn's disease.

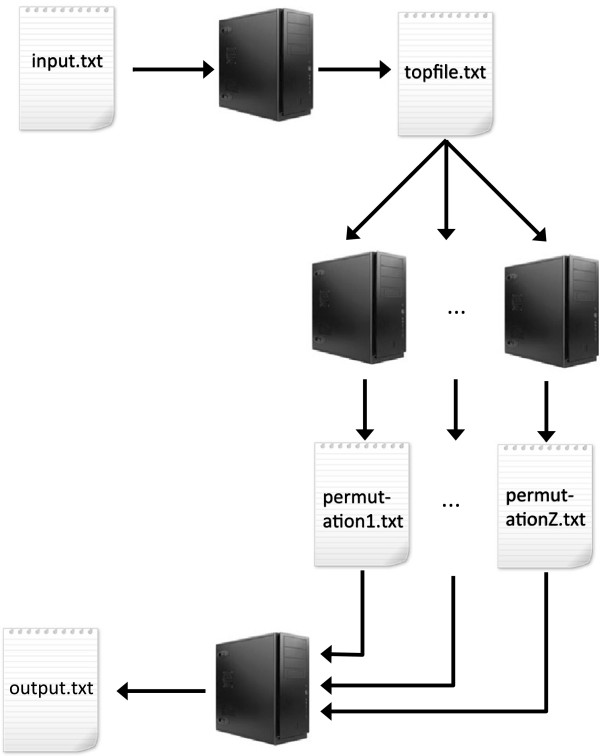
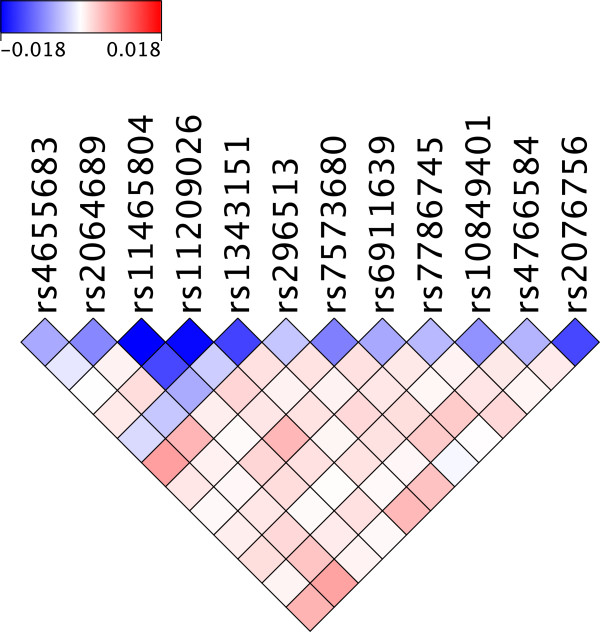
Results: In the case of a binary (affected/unaffected) trait, the parallel workflow of MBMDR-3.0.3 analyzes all gene-gene interactions with a dataset of 100,000 SNPs typed on 1000 individuals within 4 days and 9 hours, using 999 permutations of the trait to assess statistical significance, on a cluster composed of 10 blades, containing each four Quad-Core AMD Opteron(tm) Processor 2352 2.1 GHz. In the case of a continuous trait, a similar run takes 9 days. Our program found 14 SNP-SNP interactions with a multiple-testing corrected p-value of less than 0.05 on real-life Crohn's disease (CD) data.

Conclusions: Our software is the first implementation of the MB-MDR methodology able to solve large-scale SNP-SNP interactions problems within a few days, without using much memory, while adequately controlling the type I error rates. A new implementation to reach genome-wide epistasis screening is under construction. In the context of Crohn's disease, MBMDR-3.0.3 could identify epistasis involving regions that are well known in the field and could be explained from a biological point of view. This demonstrates the power of our software to find relevant phenotype-genotype higher-order associations.


Figures

Figure 1
Figure 1
Input/output formats of MBMDR-3.0.3. MBMDR-3.0.3 takes as argument a text file (possibly converted by our software from PLINK format) containing the trait and SNP values of the subjects under study and a set of command line parameters. If the ath subject is a case (control), ca=1(0) (a=1…s). SNPb is a label referring to the bth SNP (b=1,…M). The genotype of an individual a at locus b is denoted as gab (0 if homozygous for the first allele, 1 if heterozygous and 2 if homozygous for the second allele). The produced output is a text file containing the most significant SNP pairs in relation with the trait. (SNPlj,SNPrj) refers to the jth best SNP pair, i.e. the pair with the jth lowest p-value pj. Our software has only one mandatory argument: the scale of the trait. Use either −−binary for a binary trait, or −−continuous for a continuous scale, or −−survival for a censored trait (in this case the trait column is replaced by two columns, one for the time variable and one for the censoring variable). We have developed an interactive help, accessible through −−help, describing all other options. For instance, -n sets the amount of p-values to compute (default: 1000), -p sets the amount of permutations to asses statistical significance (default: 999).
Figure 2
Figure 2
Classical versus Van Lishout’s implementation of maxT. In the classical maxT implementation, all Ti,j values are in memory. If only the x best p-values are envisaged then only the maximum M1,…,MB of the [T1,n+1,…,T1,m],…,[TB,n+1,…,TB,m] are needed, implying only temporary storage of the corresponding values.
Figure 3
Figure 3
MBMDR-3.0.3 parallel workflow. Step 1 of the maxT algorithm is first performed on the input file. This produce the file topfile.txt, containing the top pairs of SNPs and their corresponding test-statistics. Then, the computation of the permutations is split between the available machines. Finally, MBMDR-3.0.3 reads the produced permutationx.txt files to create the final output file.
Figure 4
Figure 4
Decomposition of the different steps of the computation of Ti,j. ca is 1 (0) if the ath subject is a case (control) for the ith permutation of the trait. galj and garj are 0, 1 or 2 depending on the genotype of the ath subject for the jth pair. Amn and Umn are respectively the number of affected/unaffected subjects, whose genotype gkl= m and gkr= n. Rmn is either “H” if the subjects whose genotype is m for SNPlj and n for SNPrj have a high statistical risk of disease, “L” if they have a low statistical risk and “O” if there is no statistical evidence.
Figure 5
Figure 5
SD plot. Synergy Disequilibrium (SD) plot of potential epistasis interactions between the loci indicated in Table 3

Similar articles

Cited by

References

    1. Hardy J, Singleton A. Genome-wide association studies and human disease. N Engl J Med. 2009;360:1759–1768. doi: 10.1056/NEJMra0808700. - DOI - PMC - PubMed
    1. Manolio TA, Collins FS, Goldstein DB, Hindorff LA, Hunter DJ, McCarthy MI, Ramos EM, Cardon LR, Chakravarti A, Cho JH. Finding the missing heritability of complex diseases. Nature. 2009;461(7265):747–753. doi: 10.1038/nature08494. - DOI - PMC - PubMed
    1. Visscher PM, Brown MA, McCarthy MI, Yang J. Five years of GWAS discovery. Am Soc Hum Genet. 2012;90:7–24. doi: 10.1016/j.ajhg.2011.11.029. - DOI - PMC - PubMed
    1. Zuk O, Hechter E, Sunyaev SR, Lander ES. The mystery of missing heritability: genetic interactions create phantom heritability. Proc Natl Acad Sci. 2012;109(4):1193–1198. doi: 10.1073/pnas.1119675109. - DOI - PMC - PubMed
    1. Van Steen K. Traveling the world of gene-gene interactions. Brief Bioinform. 2011;13:1–19. - PubMed

Publication types