Gene expression patterns following unilateral traumatic brain injury reveals a local pro-inflammatory and remote anti-inflammatory response
- PMID: 23617241
- PMCID: PMC3669032
- DOI: 10.1186/1471-2164-14-282
Gene expression patterns following unilateral traumatic brain injury reveals a local pro-inflammatory and remote anti-inflammatory response
Abstract
Background: Traumatic brain injury (TBI) results in irreversible damage at the site of impact and initiates cellular and molecular processes that lead to secondary neural injury in the surrounding tissue. We used microarray analysis to determine which genes, pathways and networks were significantly altered using a rat model of TBI. Adult rats received a unilateral controlled cortical impact (CCI) and were sacrificed 24 h post-injury. The ipsilateral hemi-brain tissue at the site of the injury, the corresponding contralateral hemi-brain tissue, and naïve (control) brain tissue were used for microarray analysis. Ingenuity Pathway Analysis (IPA) software was used to identify molecular pathways and networks that were associated with the altered gene expression in brain tissues following TBI.
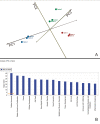
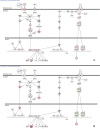
Results: Inspection of the top fifteen biological functions in IPA associated with TBI in the ipsilateral tissues revealed that all had an inflammatory component. IPA analysis also indicated that inflammatory genes were altered on the contralateral side, but many of the genes were inversely expressed compared to the ipsilateral side. The contralateral gene expression pattern suggests a remote anti-inflammatory molecular response. We created a network of the inversely expressed common (i.e., same gene changed on both sides of the brain) inflammatory response (IR) genes and those IR genes included in pathways and networks identified by IPA that changed on only one side. We ranked the genes by the number of direct connections each had in the network, creating a gene interaction hierarchy (GIH). Two well characterized signaling pathways, toll-like receptor/NF-kappaB signaling and JAK/STAT signaling, were prominent in our GIH.
Conclusions: Bioinformatic analysis of microarray data following TBI identified key molecular pathways and networks associated with neural injury following TBI. The GIH created here provides a starting point for investigating therapeutic targets in a ranked order that is somewhat different than what has been presented previously. In addition to being a vehicle for identifying potential targets for post-TBI therapeutic strategies, our findings can also provide a context for evaluating the potential of therapeutic agents currently in development.
Figures


References
-
- Zaloshnja E, Miller T, Langlois JA, Selassie AW. Prevalence of long-term disability from traumatic brain injury in the civilian population of the United States, 2005. J Head Trauma Rehabil. 2008;23(6):394–400. doi: 10.1097/01.HTR.0000341435.52004.ac. - DOI - PubMed
-
- Faul M, Xu L, Wald MM, Coronado VG. Traumatic brain injury in the United States: emergency department visits, hospitalizations and deaths 2002–2006. Atlanta (GA): Centers for Disease Control and Prevention, National Center for Injury Prevention and Control; 2010.
-
- Coronado VG, Xu L, Basavaraju SV, McGuire LC, Wald MM, Faul MD, Guzman BR, Hemphill JD. Surveillance for traumatic brain injury-related deaths–United States, 1997–2007. MMWR Surveill Summ. 2011;60(5):1–32. - PubMed
-
- McIntosh TK, Saatman KE, Raghupathi R, Graham DI, Smith DH, Lee VM, Trojanowski JQ. The Dorothy Russell Memorial Lecture. The molecular and cellular sequelae of experimental traumatic brain injury: pathogenetic mechanisms. Neuropathol Appl Neurobiol. 1998;24(4):251–267. doi: 10.1046/j.1365-2990.1998.00121.x. - DOI - PubMed
Publication types
MeSH terms
Grants and funding
- TL1 RR025010/RR/NCRR NIH HHS/United States
- T15 LM007056/LM/NLM NIH HHS/United States
- KL2 RR025009/RR/NCRR NIH HHS/United States
- G12 RR003034/RR/NCRR NIH HHS/United States
- U01 NS 057993/NS/NINDS NIH HHS/United States
- U01 NS057993/NS/NINDS NIH HHS/United States
- 5P20M006131-02/PHS HHS/United States
- U54 RR026137/RR/NCRR NIH HHS/United States
- S21MD000101/MD/NIMHD NIH HHS/United States
- TL1 TR000456/TR/NCATS NIH HHS/United States
- UL1 TR000454/TR/NCATS NIH HHS/United States
- G12RR003034/RR/NCRR NIH HHS/United States
- U54 MD007588/MD/NIMHD NIH HHS/United States
- KL2 TR000455/TR/NCATS NIH HHS/United States
- S21 MD000101/MD/NIMHD NIH HHS/United States
- U54 NS060659/NS/NINDS NIH HHS/United States
- 52006306/HHMI/Howard Hughes Medical Institute/United States
- UL1 RR025008/RR/NCRR NIH HHS/United States
LinkOut - more resources
Full Text Sources
Other Literature Sources
Molecular Biology Databases

