. 2013 Apr 24:14:278.
doi: 10.1186/1471-2164-14-278.

Gene promoters show chromosome-specificity and reveal chromosome territories in humans

Affiliations

Gene promoters show chromosome-specificity and reveal chromosome territories in humans

Paul Gagniuc et al. BMC Genomics. .

Abstract

Background: Gene promoters have guided evolution processes for millions of years. It seems that they were the main engine responsible for the integration of different mutations favorable for the environmental conditions. In cooperation with different transcription factors and other biochemical components, these regulatory regions dictate the synthesis frequency of RNA molecules. Predominantly in the last decade, it has become clear that nuclear organization impacts upon gene regulation. To fully understand the connections between Homo sapiens chromosomes and their gene promoters, we analyzed 1200 promoter sequences using our Kappa Index of Coincidence method.

Results: In order to measure the structural similarity of gene promoters, we used two-dimensional image-based patterns obtained through Kappa Index of Coincidence (Kappa IC) and (C+G)% values. The center of weight of each promoter pattern indicated a structure similarity between promoters of each chromosome. Furthermore, the proximity of chromosomes seems to be in accordance to the structural similarity of their gene promoters. The arrangement of chromosomes according to Kappa IC values of promoters, shows a striking symmetry between the chromosome length and the structure of promoters located on them. High Kappa IC and (C+G)% values of gene promoters were also directly associated with the most frequent genetic diseases. Taking into consideration these observations, a general hypothesis for the evolutionary dynamics of the genome has been proposed. In this hypothesis, heterochromatin and euchromatin domains exchange DNA sequences according to a difference in the rate of Slipped Strand Mispairing and point mutations.

Conclusions: In this paper we showed that gene promoters appear to be specific to each chromosome. Furthermore, the proximity between chromosomes seems to be in accordance to the structural similarity of their gene promoters. Our findings are based on comprehensive data from Transcriptional Regulatory Element Database and a new computer model whose core is using Kappa index of coincidence.


Figures

Figure 1
Figure 1
DNA pattern analysis of promoters. (A) promoter sequences, (B) Kappa IC and (C+G)% values extracted from each sliding window, (C) image-based promoter patterns generated using Kappa IC and (C+G)% values, (D) general distribution of promoters using the center of weight of each promoter pattern. Red color areas represent denser clusters of promoters.
Figure 2
Figure 2
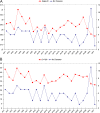
An overall promoter-chromosome specificity and chromosome vicinities. (A) red line shows the (C+G)% content for promoter sequences of each chromosome while in parallel, the blue line shows the value of Kappa IC for promoters of each chromosome, (B) diamond-shaped blue points show the position of each chromosome according to the content of (C+G)% (y-axis) and Kappa IC values (x-axis), (C) shows the correspondence between the order of chromosomes after Kappa IC and (C+G)% values of promoters. Light blue bars shows the relative length of chromosomes when they are ordered by (C+G)% values of promoters, (D) red arrows show the order of chromosomes by Kappa IC while blue arrows show the order of chromosomes after (C+G)% values.
Figure 3
Figure 3
Recycle hypothesis. (A) dark blue - heterochromatin domain, (B) light blue - euchromatin domain, (C) light blue circle in the middle – the nucleolar organizing regions. Blue arrows suggest the exchange of newly formed SSRs from A, with degraded SSRs from B.
Figure 4
Figure 4
Comparison of observed chromosome vs. general predicted positions. (A) experimental results taken from human fibroblast nuclei in G0 phase by Bolzer et al., (B) Green and red dots show the position of each chromosome according to the content of (C+G)% (y-axis) and Kappa IC values (x-axis). The peripheral dots (red color) from panel B correspond to perimeter 2 area from panel A, whereas central dots (green color) from panel B correspond to perimeter 1 from panel A. The curved dotted lines delimit the red from the green dots to show the correlation with Bolzer et al. distribution. Diagonal dotted line shows the correlation with Lieberman-Aiden E et al. observation regarding chromosomes 16,17, 19, 20, 21 and 22.
Figure 5
Figure 5
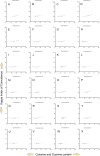
Promoter distribution for each chromosome. (A-X) Each blue point represents the center of weight from a promoter pattern belonging to chromosomes 1 up to Y. Red circles represent the blue points center of weight.
Figure 6
Figure 6
The number of genetic diseases vs. promoter Kappa IC and (C+G) values. (A) the number of genetic diseases/chromosome compared with promoter Kappa IC values/chromosome, (B) the number of genetic diseases/chromosome compared with promoter (C+G) values/chromosome. The scale on the right indicates the number of genetic diseases/chromosome.
Figure 7
Figure 7
Location of SSRs and STRs within image-based promoter patterns. The blue shape represents a model of a promoter pattern in which we approximate the location of various structures that compose a promoter sequence. (A) long Poly(dA) or Poly(dT) tracts or tandem short Poly(dA) or Poly(dT) tracts, (B) non-ordered short Poly(dA) and Poly(dT) and Poly(dC) and Poly(dG) tracts, (C) long Poly(dC) or Poly(dG) tracts or tandem short Poly(dC) or Poly(dG) tracts, (D) short Poly(dC) and Poly(dG) tracts, (E) evenly interspersed nucleotides (A,T,C,G ≈ 25%), (F) short Poly (dA) and Poly(dT) tracts.

References

    1. Mendelsohn ML. Autoradiographic analysis of cell proliferation in spontaneous breast cancer of C3H mouse. III. The growth fraction. J Natl Cancer Inst. 1962;28:1015–1029. - PubMed
    1. Zetterberg A, Larsson O. Kinetic analysis of regulatory events in G1 leading to proliferation or quiescence of Swiss 3T3 cells. Proc Natl Acad Sci USA. 1985;82:5365–5369. doi: 10.1073/pnas.82.16.5365. - DOI - PMC - PubMed
    1. Coller HA. What's taking so long? S-phase entry from quiescence versus proliferation. Nat Rev Mol Cell Biol. 2007;8(8):667–70. doi: 10.1038/nrm2223. - DOI - PubMed
    1. Jackson DA. The anatomy of transcription sites. Curr Opin Cell Biol. 2003;15(3):311–7. doi: 10.1016/S0955-0674(03)00044-9. - DOI - PubMed
    1. Jackson DA. The amazing complexity of transcription factories. Brief Funct Genomic Proteomic. 2005;4(2):143–57. doi: 10.1093/bfgp/4.2.143. - DOI - PubMed

Publication types

LinkOut - more resources