

Effect of insulin analog initiation therapy on LDL/HDL subfraction profile and HDL associated enzymes in type 2 diabetic patients
- PMID: 23617853
- PMCID: PMC3653690
- DOI: 10.1186/1476-511X-12-54
Effect of insulin analog initiation therapy on LDL/HDL subfraction profile and HDL associated enzymes in type 2 diabetic patients
Abstract
Background: Insulin treatment can lead to good glycemic control and result in improvement of lipid parameters in type 2 diabetic patients. This study was designed to evaluate the effect of insulin analog initiation therapy on low-density lipoprotein (LDL)/ high-density lipoprotein (HDL) sub-fractions and HDL associated enzymes in type 2 diabetic patients during early phase.
Methods: Twenty four type 2 diabetic patients with glycosylated hemoglobin (HbA1c) levels above 10% despite ongoing combination therapy with sulphonylurea and metformin were selected. Former treatment regimen was continued for the first day followed by substitution of sulphonylurea therapy with different insulin analogs (0.4 U/kg/day) plus metformin. Glycemic profiles were determined over 72 hours by continuous glucose monitoring system (CGMS) and blood samples were obtained from all patients at 24 and 72 hours. Plasma levels of cholesteryl ester transfer protein (CETP), lecithin-cholesterol acyltransferase (LCAT), apolipoprotein B (apoB) and apolipoprotein A-1 (apoA-I) were determined by enzyme-linked immunosorbent assay (ELISA). Measurement of CETP and LCAT activity was performed via fluorometric analysis. Paraoxonase (PON1) enzyme activity was assessed from the rate of enzymatic hydrolysis of phenyl acetate to phenol formation. LDL and HDL subfraction analysis was done by continuous disc polyacrylamide gel electrophoresis.
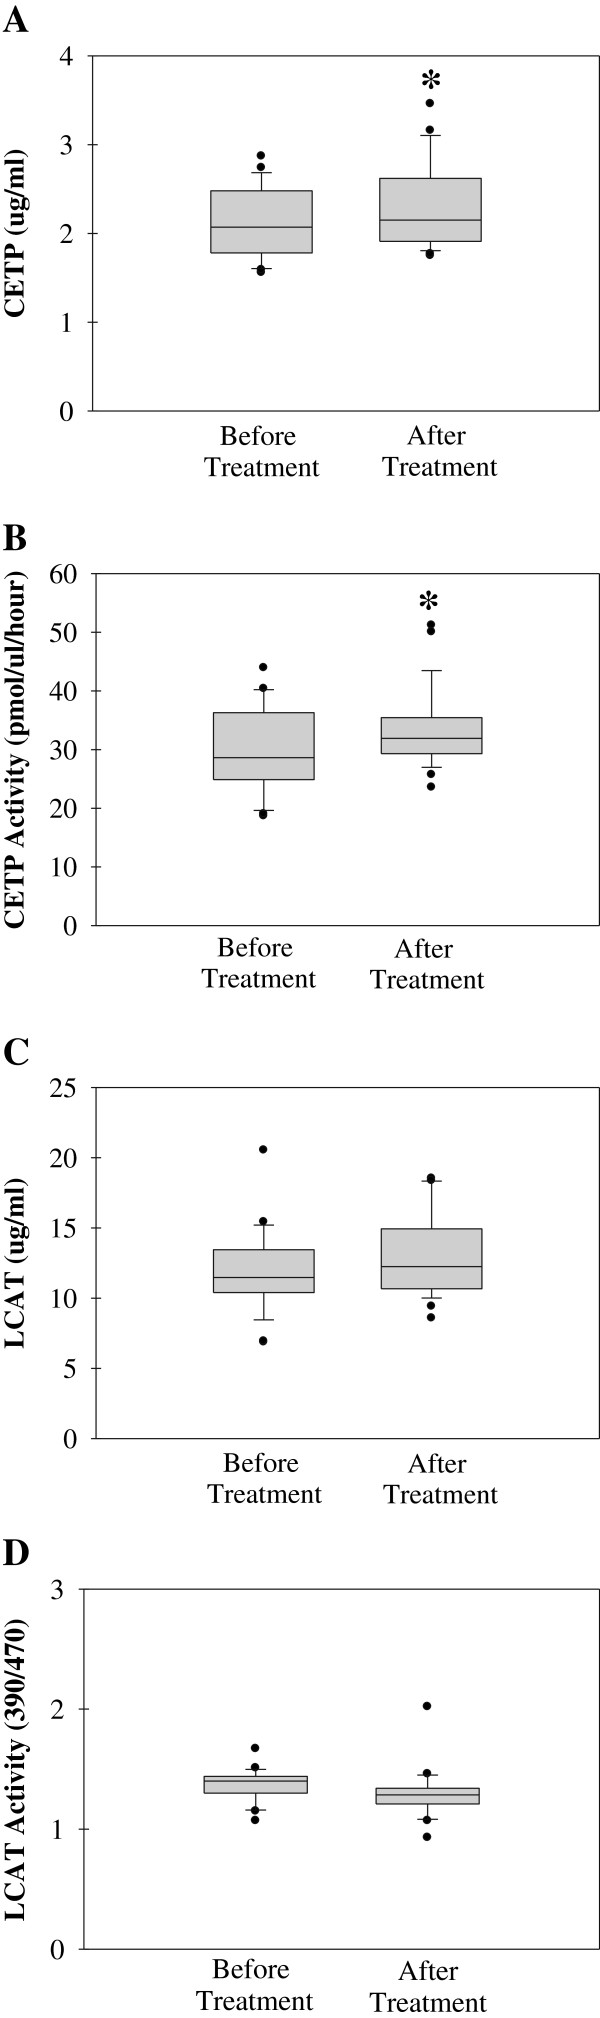
Results: Mean blood glucose, total cholesterol (TC), triglyceride (TG) and very low-density lipoprotein cholesterol (VLDL-C) levels were significantly decreased while HDL-C levels were significantly increased after insulin treatment. Although LDL-C levels were not significantly different before and after insulin initiation therapy a significant increase in LDL-1 subgroup and a significant reduction in atherogenic LDL-3 and LDL-4 subgroups were observed. Insulin analog initiation therapy caused a significant increase in HDL-large, HDL- intermediate and a significant reduction in HDL-small subfractions. CETP protein level and activity was significantly increased while apoB levels were significantly decreased following insulin analog initiation therapy. No significant difference was found in LCAT mass, LCAT activity, apoA-I and PON-1 arylesterase levels following insulin initiation therapy.
Conclusion: These findings indicate that insulin analog initiation therapy activates lipid metabolism via up-regulating CETP and shows anti-atherogenic effects by increasing HDL-large and decreasing LDL-3 and LDL-4 subfractions in a short time period.
Figures


References
-
- American Diabetes Association. Management of dyslipidemia in adults with diabetes. Diabetes Care. 2000;23(Suppl 1):S57–S60. - PubMed
-
- Van J, Pan J, Charles MA, Krauss R, Wong N, Wu X. Atherogenic lipid phenotype in a general group of subjects. Arch Pathol Lab Med. 2007;131(11):1679–1685. - PubMed
-
- Pyŏrälä K, Pedersen TR, Kjekshus J, Faergeman O, Olsson AG, Thorgeirsson G. Cholesterol lowering with simvastatin improves prognosis of diabetic patients with coronary heart disease. A subgroup analysis of the scandinavian simvastatin survival study (4S) Diabetes Care. 1997;20(4):614–620. doi: 10.2337/diacare.20.4.614. - DOI - PubMed
Publication types
MeSH terms
Substances
LinkOut - more resources
Full Text Sources
Other Literature Sources
Medical
Miscellaneous
