

A robustness study of parametric and non-parametric tests in model-based multifactor dimensionality reduction for epistasis detection
- PMID: 23618370
- PMCID: PMC3668290
- DOI: 10.1186/1756-0381-6-9
A robustness study of parametric and non-parametric tests in model-based multifactor dimensionality reduction for epistasis detection
Abstract
Background: Applying a statistical method implies identifying underlying (model) assumptions and checking their validity in the particular context. One of these contexts is association modeling for epistasis detection. Here, depending on the technique used, violation of model assumptions may result in increased type I error, power loss, or biased parameter estimates. Remedial measures for violated underlying conditions or assumptions include data transformation or selecting a more relaxed modeling or testing strategy. Model-Based Multifactor Dimensionality Reduction (MB-MDR) for epistasis detection relies on association testing between a trait and a factor consisting of multilocus genotype information. For quantitative traits, the framework is essentially Analysis of Variance (ANOVA) that decomposes the variability in the trait amongst the different factors. In this study, we assess through simulations, the cumulative effect of deviations from normality and homoscedasticity on the overall performance of quantitative Model-Based Multifactor Dimensionality Reduction (MB-MDR) to detect 2-locus epistasis signals in the absence of main effects.
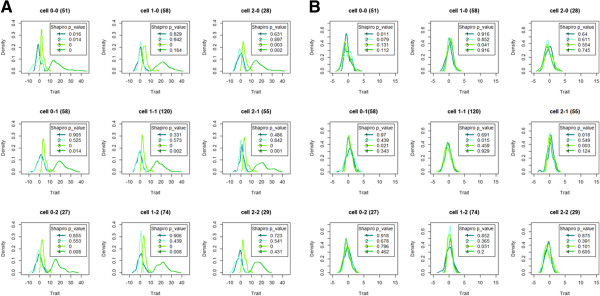
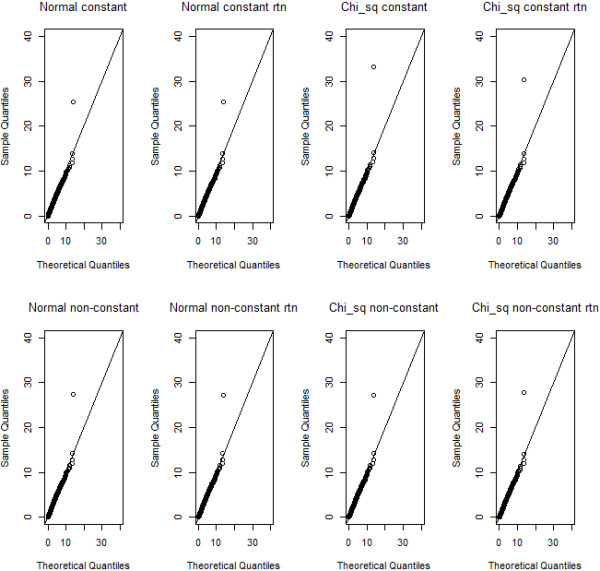
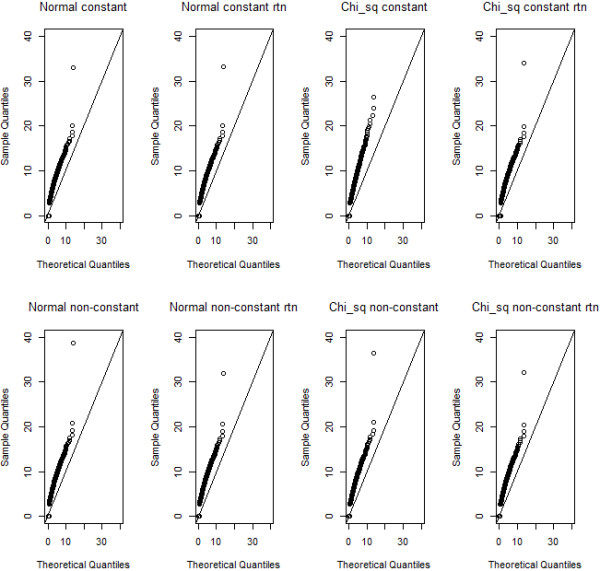
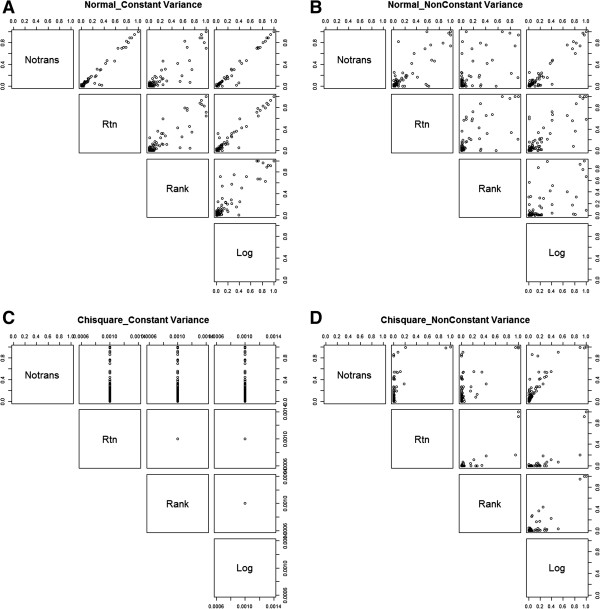
Methodology: Our simulation study focuses on pure epistasis models with varying degrees of genetic influence on a quantitative trait. Conditional on a multilocus genotype, we consider quantitative trait distributions that are normal, chi-square or Student's t with constant or non-constant phenotypic variances. All data are analyzed with MB-MDR using the built-in Student's t-test for association, as well as a novel MB-MDR implementation based on Welch's t-test. Traits are either left untransformed or are transformed into new traits via logarithmic, standardization or rank-based transformations, prior to MB-MDR modeling.
Results: Our simulation results show that MB-MDR controls type I error and false positive rates irrespective of the association test considered. Empirically-based MB-MDR power estimates for MB-MDR with Welch's t-tests are generally lower than those for MB-MDR with Student's t-tests. Trait transformations involving ranks tend to lead to increased power compared to the other considered data transformations.
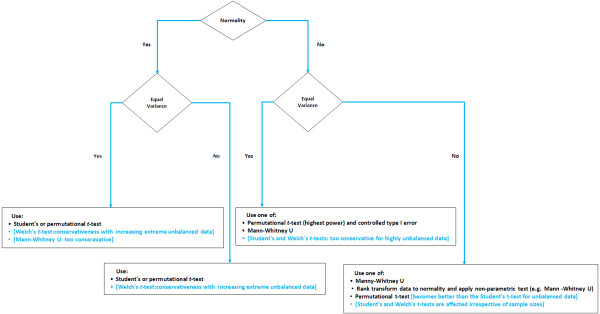
Conclusions: When performing MB-MDR screening for gene-gene interactions with quantitative traits, we recommend to first rank-transform traits to normality and then to apply MB-MDR modeling with Student's t-tests as internal tests for association.
Figures
References
-
- Mahachie John JM. Genomic Association Screening Methodology for High-Dimensional and Complex Data Structures: Detecting n-Order Interactions. Belgium: Department of Electrical Engineering and Computer Science: University of Liege; 2012.
-
- Calle ML, Urrea V, vellalta G, Malats N, Van Steen K. Model-Based Multifactor Dimensionality Reduction for detecting interactions in high-dimensional genomic data. Department of Systems Biology, UoV; 2008. http://www.recercat.net/handle/2072/5001. Accessed [20 March 2012]
-
- Cattaert T, Calle ML, Dudek SM, Mahachie John JM, Van Lishout F, Urrea V, Ritchie MD, Van Steen K. Model-Based Multifactor Dimensionality Reduction for detecting epistasis in case–control data in the presence of noise. Ann Hum Genet. 2011;75:78–89. doi: 10.1111/j.1469-1809.2010.00604.x. - DOI - PMC - PubMed
LinkOut - more resources
Full Text Sources
Other Literature Sources
Miscellaneous
