. 2013 Sep:78:385-95.
doi: 10.1016/j.neuroimage.2013.04.045. Epub 2013 Apr 22.

Characterization of non-hemodynamic functional signal measured by spin-lock fMRI

Affiliations

Characterization of non-hemodynamic functional signal measured by spin-lock fMRI

Tao Jin et al. Neuroimage. 2013 Sep.

Abstract

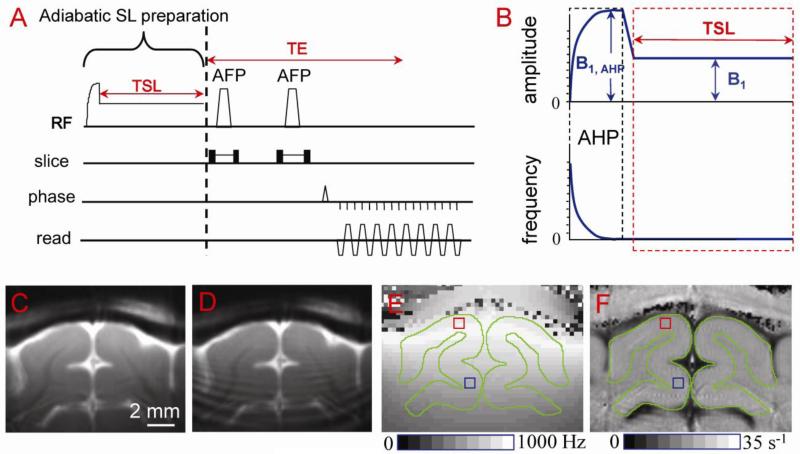
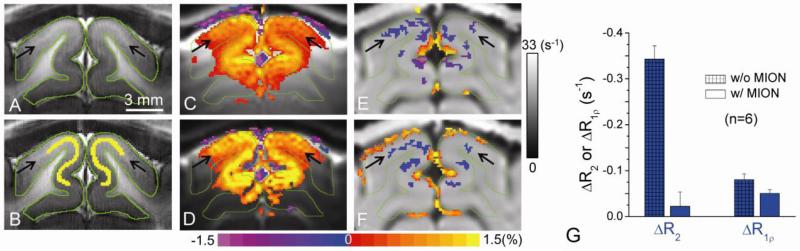
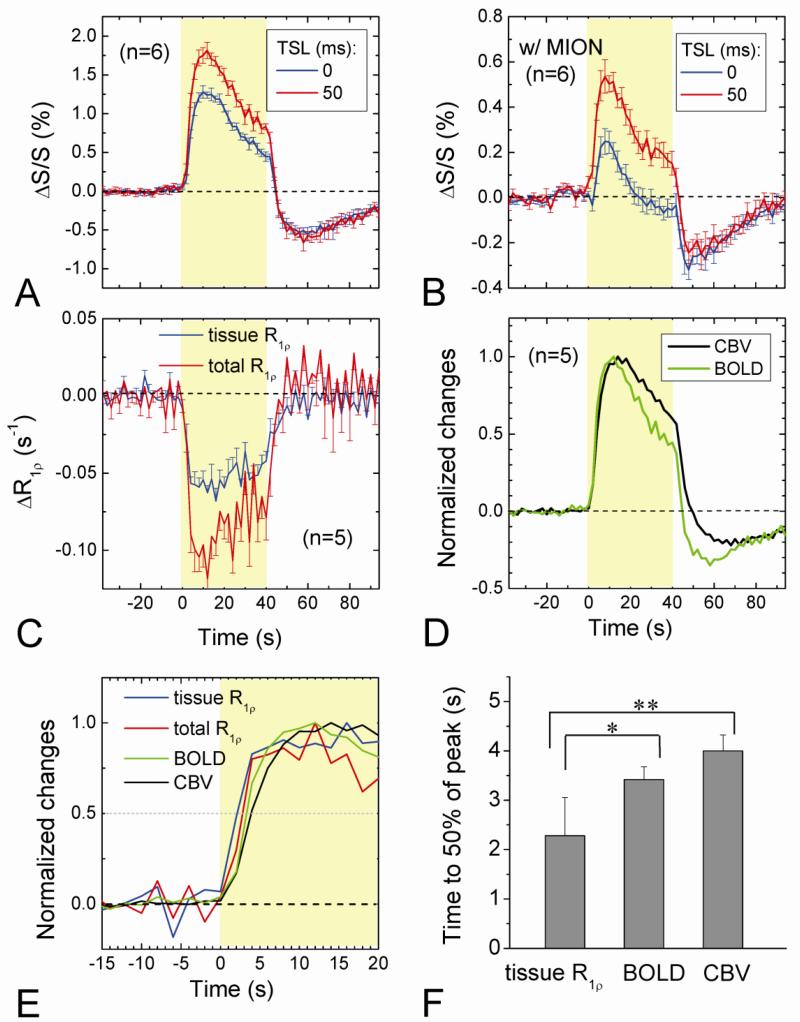
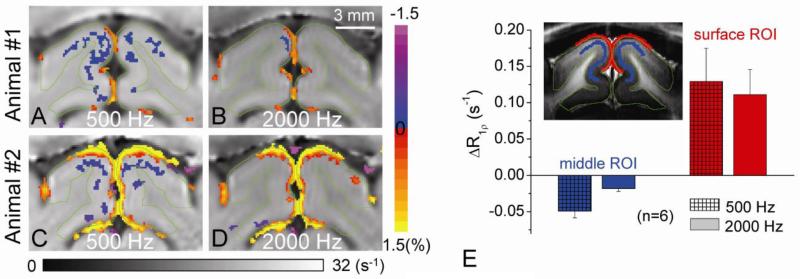
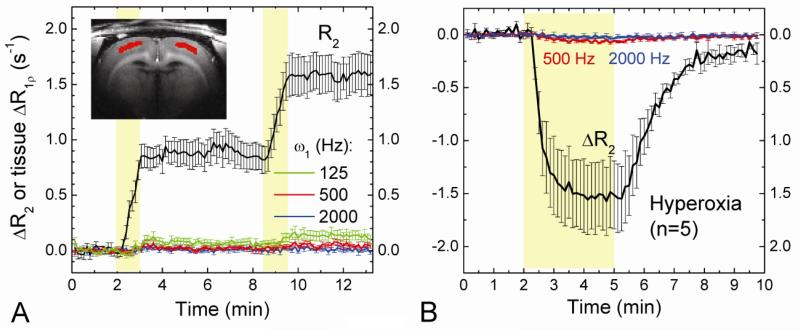
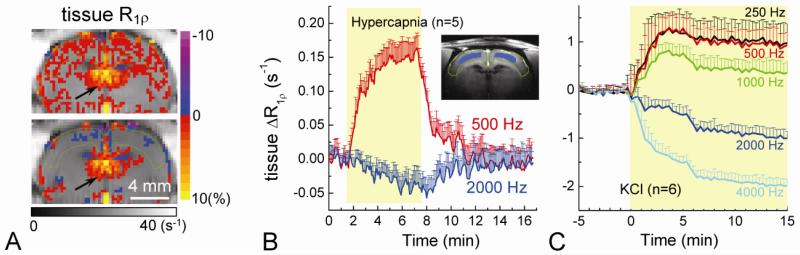
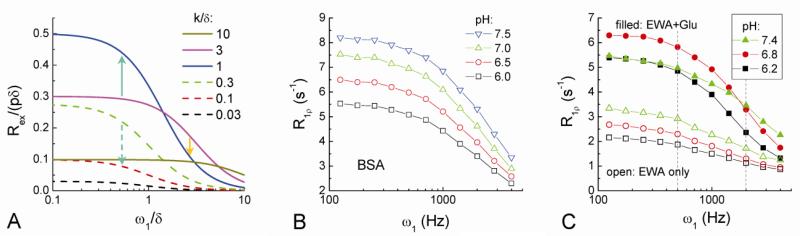
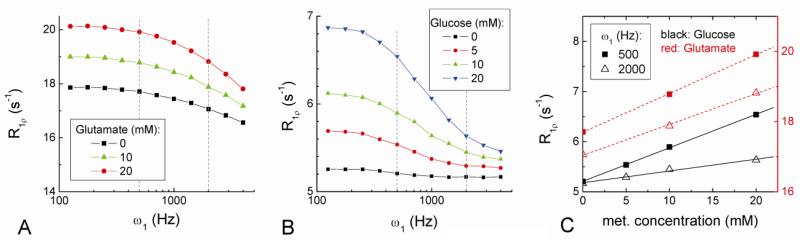
Current functional MRI techniques measure hemodynamic changes induced by neural activity. Alternative measurement of signals originated from tissue is desirable and may be achieved using T1ρ, the spin-lattice relaxation time in the rotating-frame, which is measured by spin-lock MRI. Functional T1ρ changes in the brain can have contributions from vascular dilation, tissue acidosis, and potentially other contributions. When the blood contributions were suppressed with a contrast agent at 9.4 T, a small tissue-originated T1ρ change was consistently observed at the middle cortical layers of cat visual cortex during visual stimulation, which had different dynamic characteristics compared to hemodynamic fMRI such as a faster response and no post-stimulus undershoot. Functional tissue T1ρ is highly dependent on the magnetic field strength and experimental parameters such as the power of the spin-locking pulse. With a 500Hz spin-locking pulse, the tissue T1ρ without the blood contribution increased during visual stimulation, but decreased during acidosis-inducing hypercapnia and global ischemia, indicating different signal origins. Phantom studies suggest that it may have contribution from concentration decrease in metabolites. Even though the sensitivity is much weaker than BOLD and its exact interpretation needs further investigation, our results show that non-hemodynamic functional signal can be consistently observed by spin-lock fMRI.


Figures

Fig. 1
Fig. 1. Surface-coil T1ρ pulse sequence (A, B) and applications to cat primary visual cortex studies (C-F)
The pulse sequence (A) is a double spin-echo EPI acquisition with a non-selective spin-locking (SL) preparation (B). Adiabatic half passage (AHP, 2 ms in length with amplitude B1, AHP) ensures that spins nutate into the transverse plane over a relatively large volume of B1 inhomogeneity. The RF amplitude is then immediately ramped to the desired SL level (B1) and held constant for the spin-lock time (TSL); the transmit frequency of the pulse remains the same during the short ramp and TSL. Following the spin-lock preparation, transverse spins are refocused by two adiabatic full-passage (AFP) pulses with slice-selection gradients. High quality T1ρ-weighted image (ω1 = 500 Hz and TSL = 40 ms) can be obtained when adiabatic SL condition is satisfied (C), but signal oscillations appear otherwise (D). (E) The spin-locking nutation frequency ω1 map shows B1 inhomogeneity. For our conditions, ω1 at an area proximal to the coil (red square) is ~600 Hz, while at a distal area (blue square) it is ~ 400 Hz. Gray matter areas are outlined in green. (F) The map of R1ρ (=1/T1ρ) shows little spatial variations within visual cortex because the T1ρ dispersion is very small within the narrow ω1 range (e.g., 400-600 Hz).
Fig. 2
Fig. 2. Intravascular and extravascular contributions to functional R1ρ change in the cat visual cortex
A slightly bright band (indicated by black arrows) within the gray matter (outlined in green) in high-resolution T1-weighted EPI image (A) indicates cortical layer IV (Kim and Kim, 2011). Pixels along the white band (yellow) were chosen for quantitative analyses of cat's functional studies (B). All active pixels were overlaid in color on their respective baseline images (C-F), and the vertical grayscale bar indicates the baseline R1ρ values (for E and F). Functional percentage signal change maps were obtained by T2-weighted (TSL = 0, C) and T1ρ-weighted fMRI (TSL = 50 ms and ω1 = ~500 Hz, D) without MION during visual stimulation. Higher changes were observed in T1ρ-weighted fMRI, indicating an increase in T1ρ (decrease in R1ρ). To determine the blood contribution, R1ρ change maps obtained without (E) and with (F) 5 mg/kg MION were compared. An increase in R1ρ at the surface of the cortex is due to a volume fraction change between tissue and CSF, while a decrease in R1ρ is located at the middle of the cortex. (G) At the middle cortical ROI (yellow pixels in B), the functional R2 change (ΔR2) is nearly suppressed with MION injection, whereas ΔR1ρ only decreases slightly.
Fig. 3
Fig. 3. Dynamic changes in BOLD, T1ρ-weighted fMRI, CBV, and R1ρ without and with MION during visual stimulation
Averaged time courses of T2-weighted (TSL = 0), T1ρ-weighted fMRI (TSL = 50 ms), and R1ρ change were obtained from the middle cortical ROI during visual stimulation without and with blood signal suppression with MION (A-C). The normalized time courses of BOLD and CBV show a significant undershoot after the stimulus offset (D), unlike those time courses of the two R1ρ responses (C). The BOLD, CBV, total R1ρ (without MION) and tissue R1ρ responses were normalized and their initial rising periods during stimulation were compared in (E). The rising time, defined as the time from the stimulus onset to 50% of the peak change, is faster for the tissue R1ρ than BOLD (p < 0.05, n = 5) and CBV (p < 0.01) responses (F).
Fig 4
Fig 4. Functional tissue R1ρ changes at two spin-locking frequencies
Visual stimulation-induced tissue R1ρ changes were measured after 5 mg/kg MION for two SL frequencies ω1 = 500 and 2000 Hz. Tissue R1ρ change maps of two representative animals were shown for ω1 = 500 Hz (A, C) and 2000 Hz (B, D), where the horizontal grayscale bar indicates the baseline R1ρ values and the vertical color bar indicates the functional change. The R1ρ decrease at the parenchyma is significantly reduced for ω1 = 2000 Hz, whereas the R1ρ increasing pixels at the surface of the cortex are similar for the two frequencies. The averaged change (n = 6 cats) in tissue R1ρ at ω1 = 500 Hz is 2.7 times larger than that at 2000 Hz (E).
Fig. 5
Fig. 5. Effects of intravascular susceptibility variation and hyperoxia challenge on extravascular water R1ρ
In order to detect the contribution of intravascular susceptibility changes to tissue R1ρ, the blood signal was suppressed with the injection of 5 mg/kg MION before experiments. Dynamic changes in tissue R2 and R1ρ were obtained during two injections of 1 mg/kg MION (A, n = 4 rats) and 3 minutes inhalation of 60% O2 (B, n = 5 rats) indicated by the yellow shaded regions. Time courses were obtained from the red pixels within the cortex (Inset). When spin-locking frequencies were measured at ≥500 Hz, a variation in intravascular susceptibility does not contribute to tissue R1ρ measurements.
Fig. 6
Fig. 6. Spin-locking frequency-dependent tissue R1ρ change during tissue acidosis
Tissue R1ρ changes were measured during hypercapnia and global ischemia after 5 mg/kg MION injection. Tissue R1ρ change maps for ω1 = 500 Hz and 2000 Hz are shown for hypercapnic challenge in one rat (A). Green contour indicates the cortical area. Unlike visual stimulation, an increase in tissue R1ρ was observed for ω1 = 500 Hz. Note that the increases of R1ρ near the ventricle area are similar in the two maps and can be attributed to a change of CSF volume fraction (arrows). The averaged time course (n = 5 rats) of the tissue R1ρ response obtained the cortical ROI (Inset) shows a significant increase for 500 Hz whereas a small decrease for 2000 Hz (B). The averaged tissue R1ρ responses (n = 6 rats) for ω1 from 250 to 4000 Hz during KCl injection (C), which induces tissue acidosis, show spin-locking frequency-dependent changes. These are qualitatively similar to hypercapnia.
Fig. 7
Fig. 7. Calculated Rex dispersion (A) and the measured R1ρ dispersion of pH-dependent phantoms (B-C)
Rex dispersion was calculated with Eq. [4] as a function of exchange rate k. Upward and downward arrows indicate changes in Rex when the exchange between labile protons and water is slow down due to pH decrease (see texts). The R1ρ dispersion of 8% bovine serum albumin (BSA) decreases with pH values (B). The R1ρ dispersion of 4% egg white albumin (EWA) only (open symbols) and 4% EWA with 30 mM of glutamate (filled symbols) were both measured for three pH values (C). Vertical dashed lines (C) indicate spin-locking frequencies of 500 and 2000 Hz used for in vivo studies. The addition of glutamate (Glu) changes the pH-dependence of R1ρ dispersion.
Fig. 8
Fig. 8. R1ρ dispersions of concentration-dependent amine and hydroxyl metabolite phantoms
Three amine-containing glutamate concentrations in agarose with 0.07 mM MnCl2 (A), and four hydroxyl-containing glucose (Glc) concentrations in PBS with 0.1 mM MnCl2 (B) were used. R1ρ is linearly dependent on Glu and Glc concentration, and the slope for ω1 = 500 Hz is only slightly larger than that for ω1 = 2000 Hz for Glu, but is much larger for Glc (C). The ratio of R1ρ at ω1 = 500 Hz to 2000 Hz is similar for glucose phantom (2.8) and for in vivo functional response (2.7).

Similar articles

Cited by

References

    1. Bandettini PA, Petridou N, Bodurka J. Direct detection of neuronal activity with MRI: Fantasy, possibility, or reality? Applied Magnetic Resonance. 2005;29:65–88.
    1. Borthakur A, Charagundla SR, Wheaton A, Reddy R. T-1ho-weighted MRI using a surface coil to transmit spin-lock pulses. Journal of Magnetic Resonance. 2004;167:306–316. - PubMed
    1. Borthakur A, Gur T, Wheaton AJ, Corbo M, Trojanowski JQ, Lee VMY, Reddy R. In vivo measurement of plaque burden in a mouse model of Alzheimer's disease. Journal of Magnetic Resonance Imaging. 2006;24:1011–1017. - PMC - PubMed
    1. Chen W, Novotny E, Zhu X-H, Rothman D, Shulman RG. Localized 1H NMR measurement of glucose consumption in human brain during visual stimulation. Proc Natl Acad Sci USA. 1993;90:9896–9900. - PMC - PubMed
    1. Chu RN, de Zwart JA, van Gelderen P, Fukunaga M, Kellman P, Holroyd T, Duyn JH. Hunting for neuronal currents: absence of rapid MRI signal changes during visual-evoked response. Neuroimage. 2004;23:1059–1067. - PubMed

Publication types