. 2013:3:1449.
doi: 10.1038/srep01449.

A physical sciences network characterization of non-tumorigenic and metastatic cells

Physical Sciences - Oncology Centers Network  1 David B AgusJenolyn F AlexanderWadih ArapShashanka AshiliJoseph E AslanRobert H AustinVadim BackmanKelly J BethelRichard BonneauWei-Chiang ChenChira Chen-TanyolacNathan C ChoiSteven A CurleyMatthew DallasDhwanil DamaniaPaul C W DaviesPaolo DecuzziLaura DickinsonLuis Estevez-SalmeronVeronica EstrellaMauro FerrariClaudia FischbachJasmine FooStephanie I FraleyChristian FrantzAlexander FuhrmannPhilippe GascardRobert A GatenbyYue GengSharon GerechtRobert J GilliesBiana GodinWilliam M GradyAlex GreenfieldCourtney HemphillBarbara L HempsteadAbigail HielscherW Daniel HillisEric C HollandArig Ibrahim-HashimTyler JacksRoger H JohnsonAhyoung JooJonathan E KatzLaimonas KelbauskasCarl KesselmanMichael R KingKonstantinos KonstantopoulosCasey M Kraning-RushPeter KuhnKevin KungBrian KweeJohnathon N LakinsGuillaume LambertDavid LiaoJonathan D LichtJan T LiphardtLiyu LiuMark C LloydAnna LyubimovaParag MallickJohn MarkoOwen J T McCartyDeirdre R MeldrumFranziska MichorShannon M MumenthalerVivek NandakumarThomas V O'HalloranSteve OhRenata PasqualiniMatthew J PaszekKevin G PhilipsChristopher S PoultneyKuldeepsinh RanaCynthia A Reinhart-KingRobert RosGregg L SemenzaPatti SenechalMichael L ShulerSrimeenakshi SrinivasanJack R StauntonYolanda StypulaHariharan SubramanianThea D TlstyGarth W TormoenYiider TsengAlexander van OudenaardenScott S VerbridgeJenny C WanValerie M WeaverJonathan WidomChristine WillDenis WirtzJonathan WojtkowiakPei-Hsun Wu
Affiliations

A physical sciences network characterization of non-tumorigenic and metastatic cells

Physical Sciences - Oncology Centers Network et al. Sci Rep. 2013.

Abstract

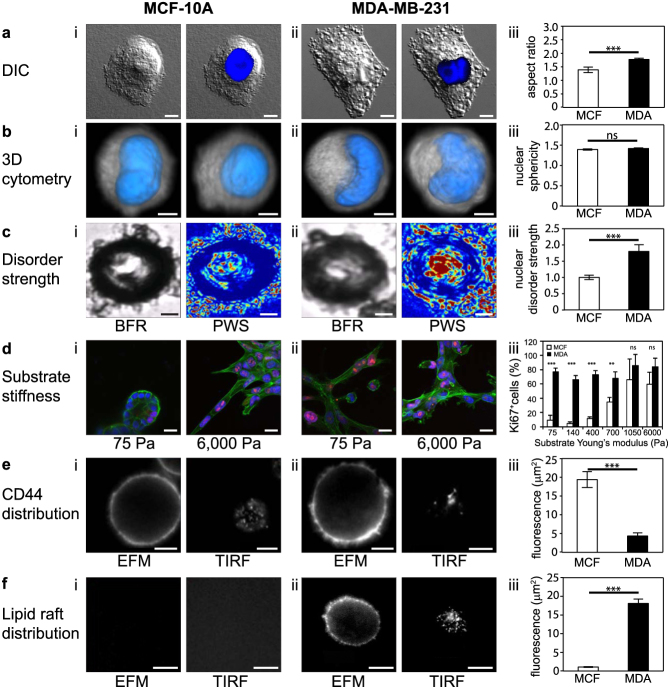
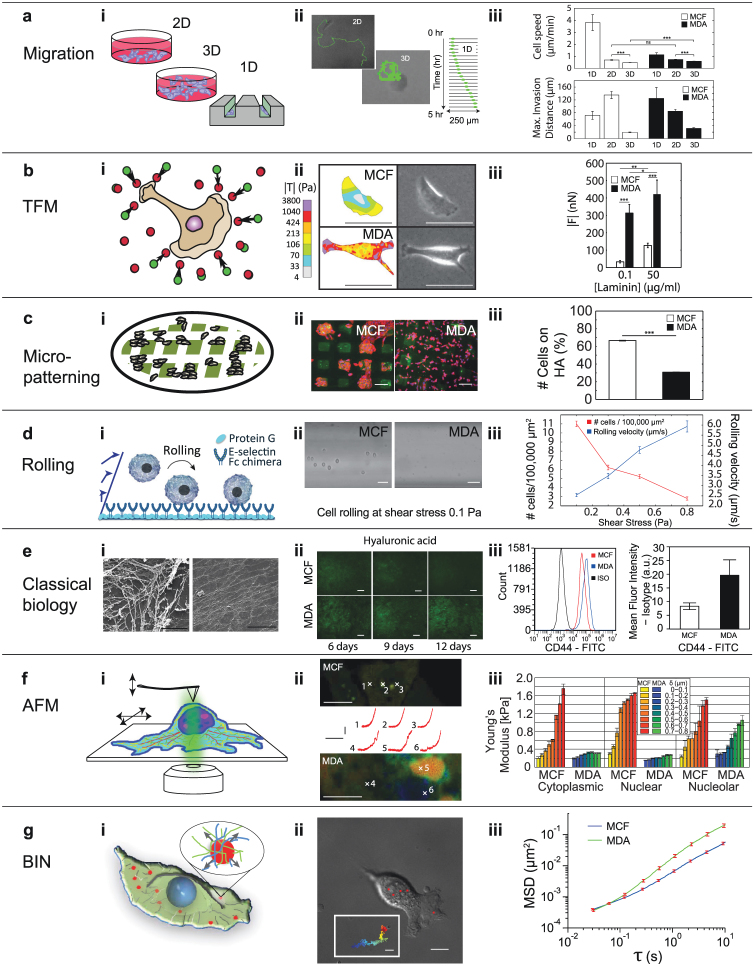
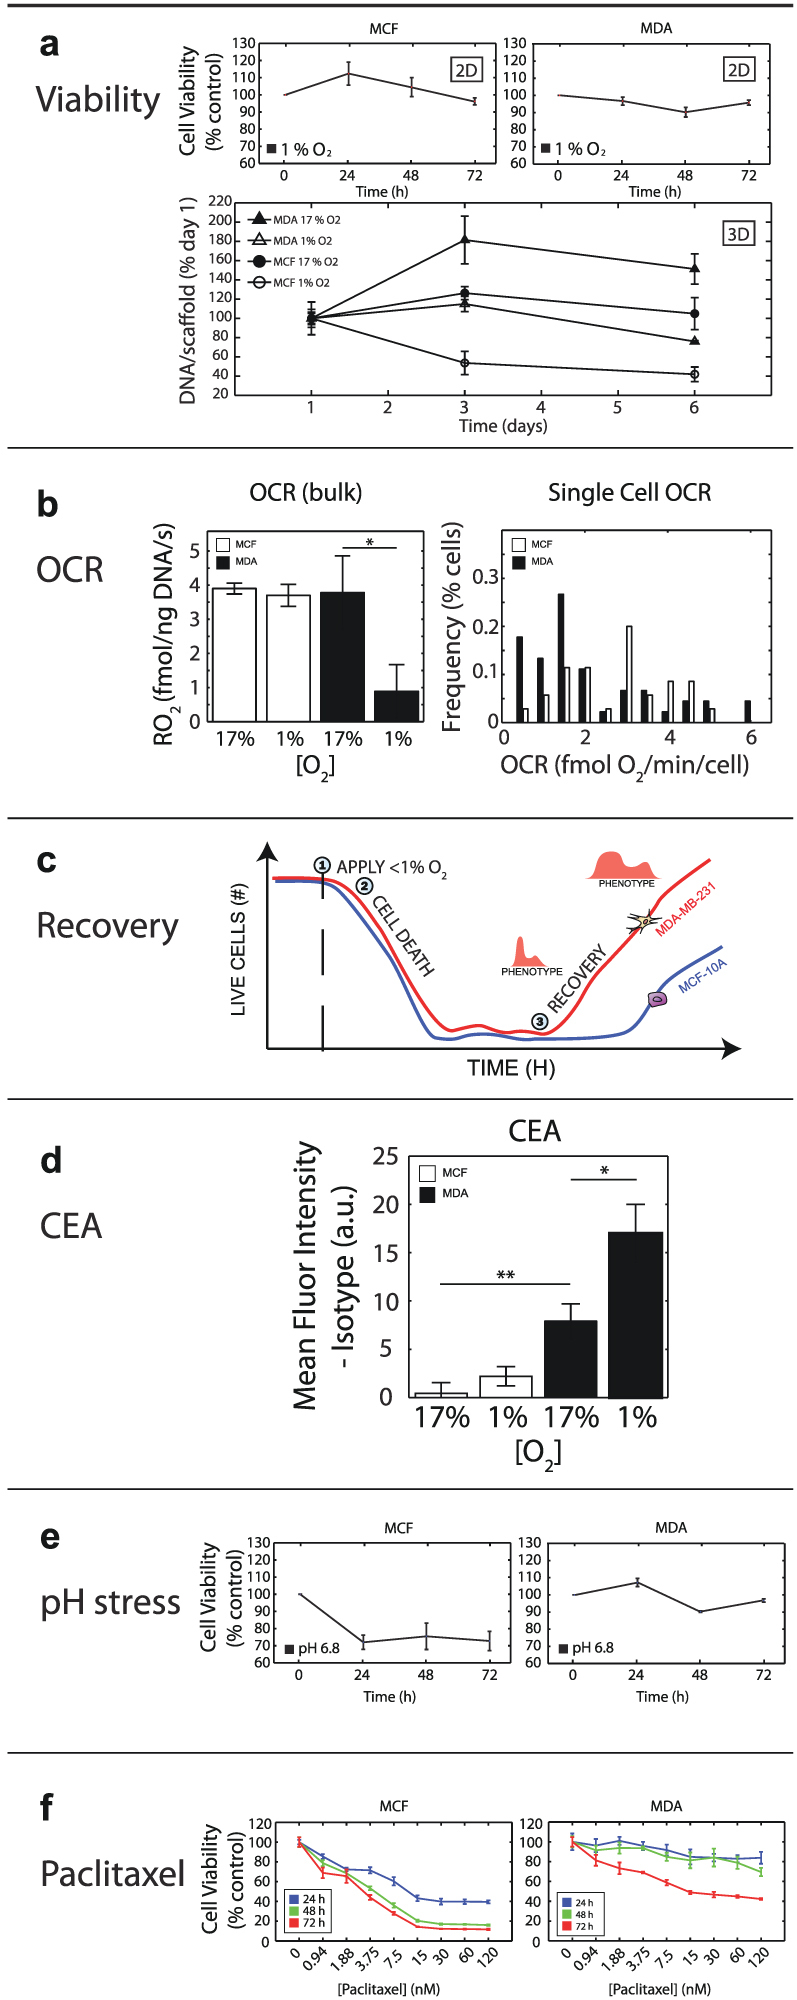
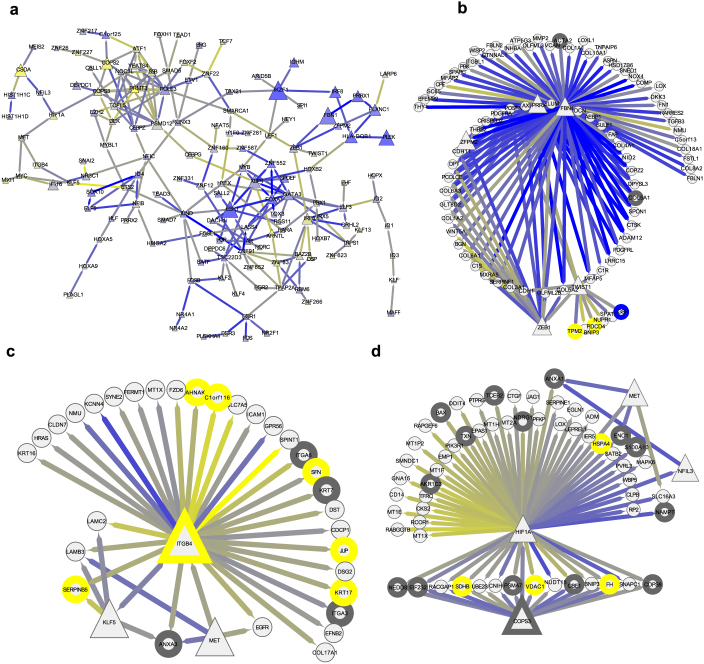
To investigate the transition from non-cancerous to metastatic from a physical sciences perspective, the Physical Sciences-Oncology Centers (PS-OC) Network performed molecular and biophysical comparative studies of the non-tumorigenic MCF-10A and metastatic MDA-MB-231 breast epithelial cell lines, commonly used as models of cancer metastasis. Experiments were performed in 20 laboratories from 12 PS-OCs. Each laboratory was supplied with identical aliquots and common reagents and culture protocols. Analyses of these measurements revealed dramatic differences in their mechanics, migration, adhesion, oxygen response, and proteomic profiles. Model-based multi-omics approaches identified key differences between these cells' regulatory networks involved in morphology and survival. These results provide a multifaceted description of cellular parameters of two widely used cell lines and demonstrate the value of the PS-OC Network approach for integration of diverse experimental observations to elucidate the phenotypes associated with cancer metastasis.


Figures

Figure 1
Figure 1. Comparative cell morphology.
(a) Differential interference contrast (DIC) microscopy. (i, ii) Left: Volume rendering from DIC micrographs of each cell type (gray, H&E stained). Right: Same as left with EFM images of DAPI stained nuclei (blue) superposed. (iii) Aspect ratios of cell bodies (mean ± s.e.m.). (b) 3D cytometry. (i,ii) Pseudo-colored volume rendering of suspended and fixed H&E stained cells imaged by optical cell CT. Cytoplasm is grey and nucleus is blue. (iii) Nuclear sphericity of the cell nuclei (mean ± s.e.m.). (c) Nuclear disorder strength. (i, ii) Left: Bright field reflectance (BFR) images. Right: PWS microscopic images. Color shows the magnitude of the nuclear disorder strength (Ld) (low: blue, high: red). Ld values normalized to 1.0 for MCF-10A cells. (iii) Nuclear disorder strength (mean ± s.e.m.). (d) Substrate stiffness. (i, ii) Confocal immunofluorescence of cells grown for 15 days in 3D on soft (Left, 75 Pa) and hard (Right, 6000 Pa) reconstituted basement membrane-conjugated polyacrylamide gel matrix. Cells stained for Ki-67 cell proliferation marker (red) and DNA using DAPI. (iii) Fraction of Ki-67 positive cells as function of substrate stiffness (mean ± s.e.m.). (e) CD44 distribution. (i, ii) CD44 distribution visualized by anti-CD44 antibodies using (Left) epifluorescence microscopy (EFM) and (Right) total internal reflection fluorescence (TIRF). (iii) Fluorescent area in μm2 calculated from TIRF images (mean ± s.e.m.). Bar graph compares significant difference in immunofluorescence intensity between TIRF images for MDA and MCF cells, not the EFM images. (f) Lipid raft distribution. (i, ii) Left: Lipid raft distribution visualized by anti-CT-B antibodies using EFM. Right: raft distribution visualized by anti-CT-B antibodies using TIRF. (iii) Fluorescent area in μm2 calculated from TIRF images (mean ± s.e.m.). All scale bars are 5 μm. All p-values are indicated according to the Michelin guide scale (p ≤ 0.001: [***]; 0.001 < p ≤ 0.01: [**]; 0.01 < p ≤ 0.05: [*]; 0.05 < p: ns).
Figure 2
Figure 2. Motility and mechanics.
(a) Three substrates used to monitor cell motility: 2D collagen-coated glass substrate, 3D collagen matrix, and 1D fibronectin-coated microchannels (13 μm wide, 25 μm deep) etched in silicon. Motion tracking based on time-lapse imaging. (i) Schematic. (ii) Tracking data. (iii) Speed (μm/min) and maximum invasion distance (mean ± s.e.m.). (b) TFM quantified traction stresses exerted by cells on 5kPa 2D polyacrylamide substrate mimicking mammary tumor stiffness by measuring displacement of embedded fluorescent polystyrene beads. Phase image followed by fluorescent images of bead field under stressed and unstressed (post-trypsinization) conditions. Bead displacement yields magnitude (|T|) and distribution of traction stresses. (i) Schematic. (ii) Tension maps (Left); phase images (Right); MCF-10A (Top); MDA-MB-231 (Bottom). Scale bars: 50 μm. (iii) Force magnitudes exerted by cells at different surface laminin concentrations (mean ± s.e.m.). (c) Microprinted Covalent HA array. (i) Schematic. (ii) CD44 expressing MCF-10A and MDA-MB-231 cells (red) attached to FL-HA micro-patterned substrates (green) after 24h culture. Scale bars: 50 μm. (iii) Cells attached to HA squares (mean ± s.e.m.). (d) Cells rolling on E-selectin surfaces. (i) Schematic. (ii) Phase images. Scale bars: 50 μm. (iii) Rolling velocities and numbers of MCF-10A cells captured on surface under physiological wall shear stresses (mean ± s.e.m.). (e) (i) SEM reveals distinct ECM structures deposited by MCF-10A (Left; scale bar: 4 μm) compared to MDA-MB-231 (Right; Scale bar: 5 μm). (ii) IF imaging of cells stained with fluorescein-tagged HA demonstrate expression of HA in both MCF-10A and MDA-MB-231. Scale bars: 50 μm. (iii) Flow cytometry shows higher CD44 expression in MDA-MB-231 compared to MCF-10A (left: histogram; right: quantified MFI). (f) AFM probe aligned with confocal fluorescence lifetime microscope scans points of interest over cytoplasm, nuclei, and nucleoli. Force-indentation curves used to calculate elastic moduli. (i) Schematic. (ii) Curves (middle) and corresponding images (top, bottom). Scale bars: 10 μm (top); 2 μm (middle, horizontal), 0.2nN (middle, vertical); 4 μm (bottom). (iii) Depth-dependent elastic moduli (mean ± s.e.m.). (g) Fluorescent nanoparticles injected into cells and trajectory monitored over time. (i) Schematic. (ii) Cell monitored in real time. Inset: nanoparticle trajectory. Scale bars: 10 μm (main); 0.2 μm (inset). (iii) MSD values over cumulative time (mean ± s.e.m.). All p-values indicated by Michelin guide scale (p ≤ 0.001:[***]; 0.001 < p ≤ 0.01:[**]; 0.01 < p ≤ 0.05:[*]; 0.05 < p:ns).
Figure 3
Figure 3. Comparative cell stress responses.
(a) Viability under hypoxia in 2D and 3D. Top: (2D) Cells grown in wells (triplicate) for 3 days in 1% O2. Viability was determined every 24 h and imaged with an inverted microscope. Cell viability (mean ± s.e.m.) normalized to day 1 samples. Bottom: (3D) DNA content per scaffold (normalized to day 1 samples) over 6 days growth in normoxic (17% O2) and hypoxic (1% O2) conditions in 3D culture (alginate discs). (b) Oxygen consumption rates. Left: bulk OCR (normalized to DNA content, mean ± s.e.m.) of cells after 6 days growth in normoxic (17% O2) or hypoxic (1% O2) conditions in 3D culture (alginate discs); Right: histogram of OCR of single cells measured in hermetically sealed chambers (17% O2). (c) Schematic of a hypothetical model in which phenotypic diversity of MDA-MB-231 cells is relatively enhanced with respect to MCF-10A due to enhanced population recovery after hypoxia-induced cell death. (d) Carcinoembryonic antigen (CEA). Mean fluorescence intensity minus isotype (MFI) of cells grown in 17% or 1% O2 (mean ± s.e.m.). (e) pH-induced stress. Percentages of viable cells grown in media with pH 6.8 (mean ± s.e.m.). (f) Paclitaxel-induced stress. Percentages of viable cells after 24, 48, and 72 h incubation with various concentrations of paclitaxel (mean ± s.e.m.). All p-values are indicated according to the Michelin guide scale (p ≤ 0.001: [***]; 0.001 < p ≤ 0.01: [**]; 0.01 < p ≤ 0.05: [*]; 0.05 < p: ns).
Figure 4
Figure 4. Comparative molecular signatures for morphology, motility, and stress.
(a) The largest connected subnetwork of transcription factors from the master network (Suppl. Fig. 3) with nodes colored to provide a "summary" of the entire network. Node size shows the number of edges (connecting lines) in the master network that were above a cutoff for specificity to either cell line. Larger nodes have more cell-line-specific edges; the largest, IKZF1, has 67 edges above the threshold. Node color is determined by the ratio of above-cutoff edges specific to MCF-10A vs. MDA-MB-231, with yellow denoting more MCF-10A edges and blue more MDA-MB-231 edges. Nodes with many edges specific to one cell line or the other are therefore large and brightly colored, such as IKZF1 or COPS2. (b-d) One-hop networks from transcription factor regulators (▵) to their targets (○). Each gene is represented as a 'node'. If a gene's abundance is regulated by another gene, this is denoted with an 'edge' between those genes. Color of an edge indicates the specificity of that regulatory relationship to either MCF-10A cells (yellow) or MDA-MB-231 cells (blue). Relationships that are equally present in both cell types are demarked grey. Node border color indicates differential proteomics results. Yellow border nodes are upregulated in MCF-10A cells. Blue border nodes are upregulated in MDA-MB-231 cells. Grey bordered nodes were quantified and found to be equivalent in both cell types. (b) Morphology network. The 1-hop morphology network from FBN1 and TWIST1, LOX and LOXL1, both putatively regulated by FBN1. Both FBN1 and TWIST1 are putatively regulated by ZEB1. Also shown are the large number of MDA-MB-231 edges from FBN1 and a fairly even distribution of edges from ZEB1. (c) Motility network. The 1-hop network from ITGB4. ITGB4 is itself a gene of interest and is inferred to regulate EGFR and several laminins. (d) Stress response network. The 1-hop network from HIF1A, a transcription factor and gene of interest. It is putatively regulated by MET (upper triangle), which is also inferred to regulate ITGB4. HIF1A putatively regulates two more genes of interest, LOX (also a putative target of FBN1 and SATB2).

References

    1. Wirtz D., Konstantopoulos K. & Searson P. C. The physics of cancer: the role of physical interactions and mechanical forces in metastasis. Nature reviews. Cancer 11, 512–522 (2011). - PMC - PubMed
    1. Hanahan D. & Weinberg R. A. Hallmarks of cancer: the next generation. Cell 144, 646–674 (2011). - PubMed
    1. Davies P. C., Demetrius L. & Tuszynski J. A. Cancer as a dynamical phase transition. Theor Biol Med Model 8, 30 (2011). - PMC - PubMed
    1. Debnath J., Muthuswamy S. K. & Brugge J. S. Morphogenesis and oncogenesis of MCF-10A mammary epithelial acini grown in three-dimensional basement membrane cultures. Methods 30, 256–268 (2003). - PubMed
    1. Cailleau R., Mackay B., Young R. K. & Reeves W. J., Jr. Tissue culture studies on pleural effusions from breast carcinoma patients. Cancer research 34, 801–809 (1974). - PubMed

Publication types