. 2013 May;123(5):2011-23.
doi: 10.1172/JCI65460. Epub 2013 Apr 24.

The absence of intrarenal ACE protects against hypertension

Affiliations

The absence of intrarenal ACE protects against hypertension

Romer A Gonzalez-Villalobos et al. J Clin Invest. 2013 May.

Abstract

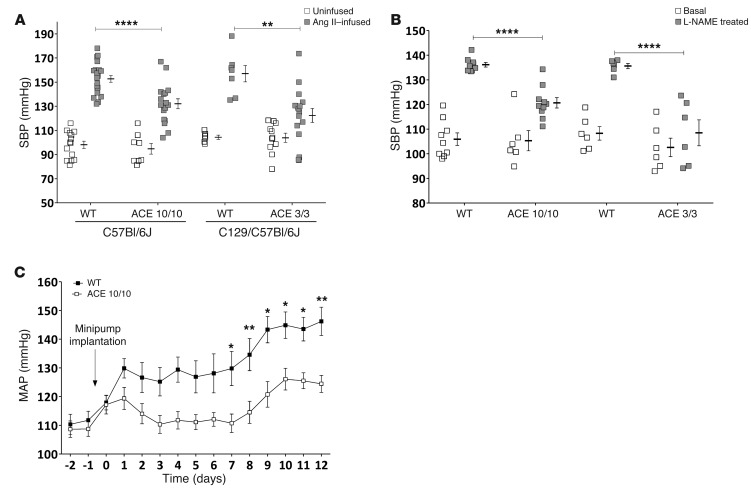
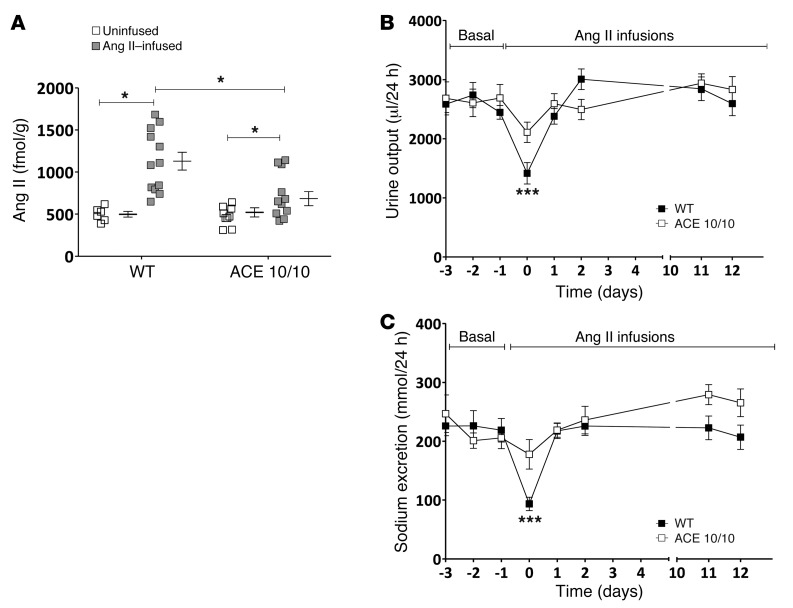
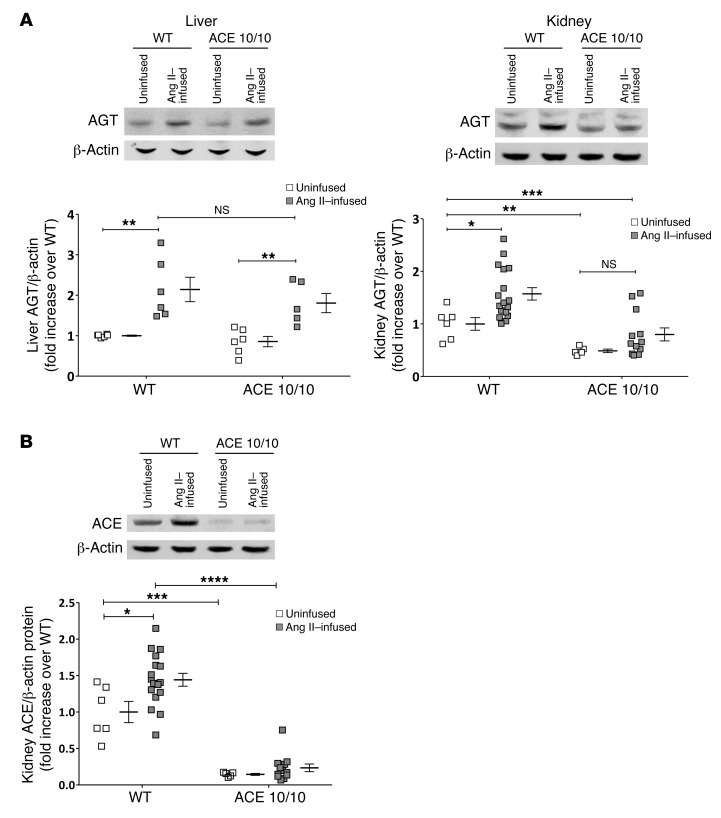
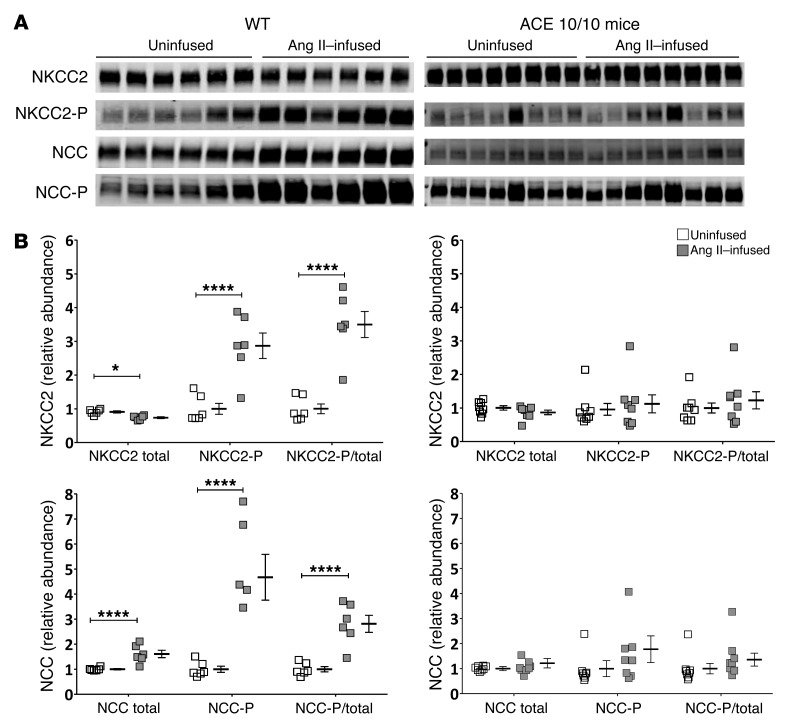
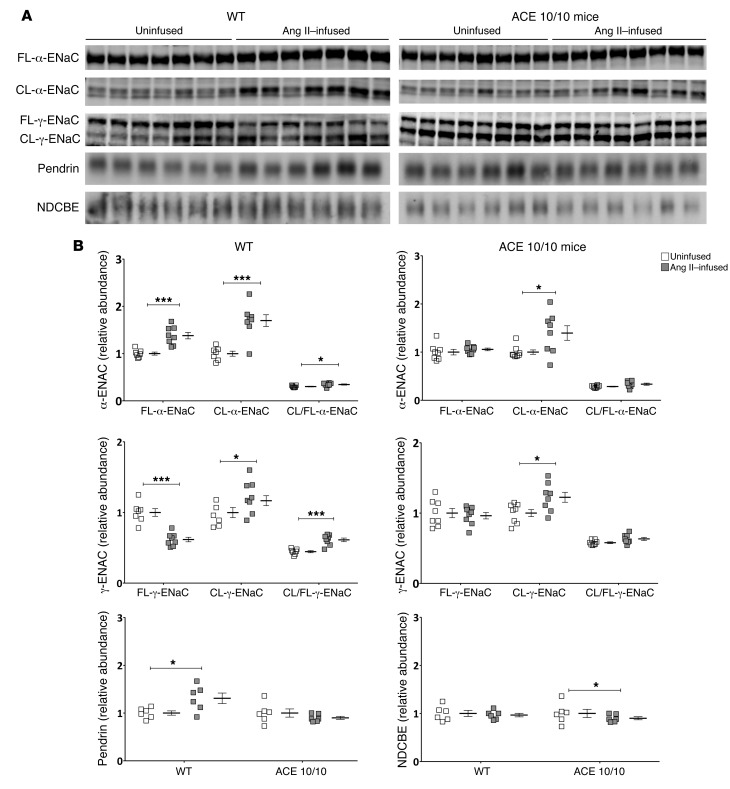
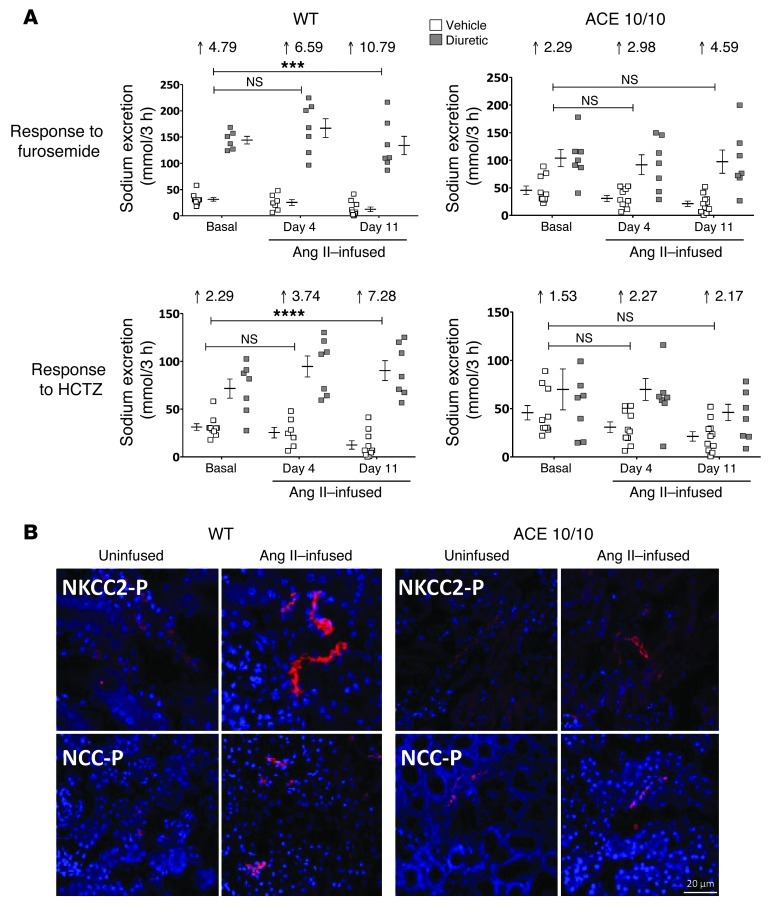
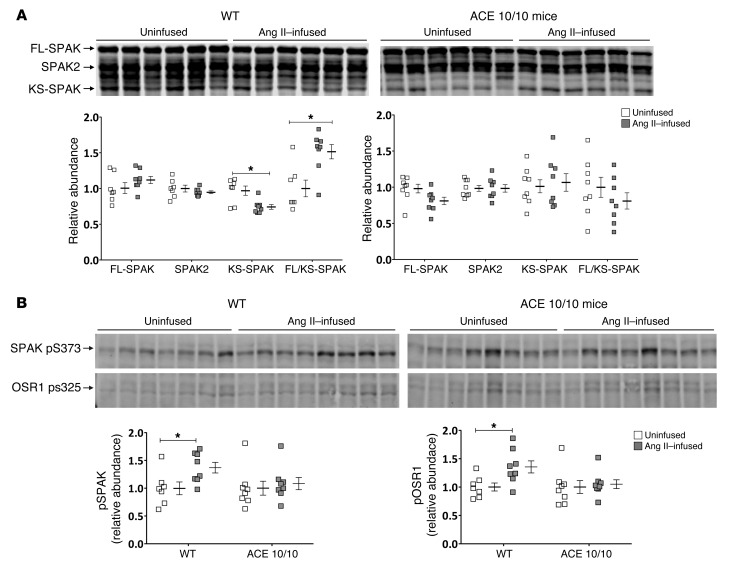
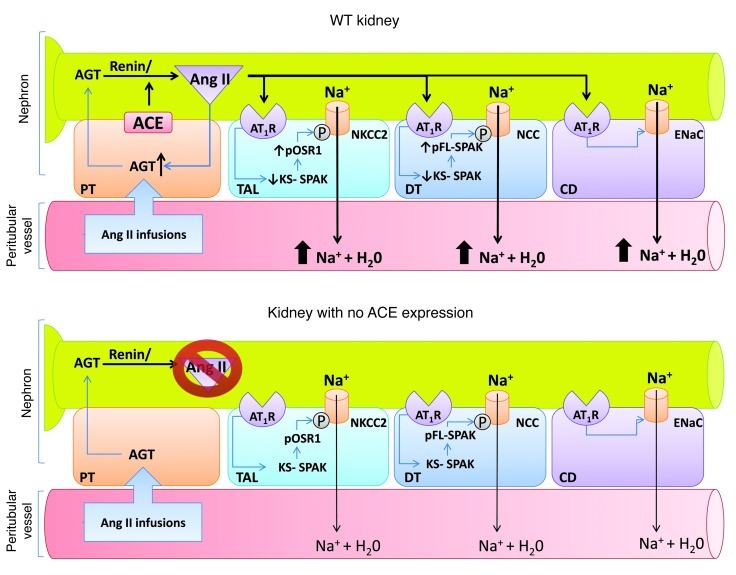
Activation of the intrarenal renin-angiotensin system (RAS) can elicit hypertension independently from the systemic RAS. However, the precise mechanisms by which intrarenal Ang II increases blood pressure have never been identified. To this end, we studied the responses of mice specifically lacking kidney angiotensin-converting enzyme (ACE) to experimental hypertension. Here, we show that the absence of kidney ACE substantially blunts the hypertension induced by Ang II infusion (a model of high serum Ang II) or by nitric oxide synthesis inhibition (a model of low serum Ang II). Moreover, the renal responses to high serum Ang II observed in wild-type mice, including intrarenal Ang II accumulation, sodium and water retention, and activation of ion transporters in the loop of Henle (NKCC2) and distal nephron (NCC, ENaC, and pendrin) as well as the transporter activating kinases SPAK and OSR1, were effectively prevented in mice that lack kidney ACE. These findings demonstrate that ACE metabolism plays a fundamental role in the responses of the kidney to hypertensive stimuli. In particular, renal ACE activity is required to increase local Ang II, to stimulate sodium transport in loop of Henle and the distal nephron, and to induce hypertension.


Figures

Figure 1
Figure 1. The absence of kidney ACE blunts the hypertensive response to Ang II infusion or l-NAME.
(A) Systolic blood pressure (SBP) of wild-type, ACE 10/10, and ACE 3/3 mice after 2 weeks of Ang II infusion (400 ng/kg/min via minipump). Blood pressure was measured by tail-cuff plethysmography. n = 6–22 per group. The corresponding background strain is indicated. (B) Systolic blood pressure of wild-type, ACE 10/10, and ACE 3/3 mice after 2 weeks of l-NAME treatment (5 mg/10 ml in the drinking water). n = 6–9 per group. (C) MAP of wild-type and ACE 10/10 mice during chronic Ang II infusion. MAP was recorded by telemetry. n = 7–8 per group. Uninfused, sham-operated mice; Basal, mice not receiving l-NAME in the drinking water. *P < 0.05, **P < 0.01, ****P < 0.0001. Values represent individual mice and mean ± SEM.
Figure 2
Figure 2. The absence of kidney ACE reduces both renal Ang II accumulation and sodium and water retention in response to Ang II infusion.
(A) Kidney Ang II content of wild-type and ACE 10/10 mice after 2 weeks of Ang II infusion (400 ng/kg/min via minipump). Ang II concentration was measured by radioimmunoanalysis. n = 6–12 per group. (B) Urine and (C) sodium output of wild-type and ACE 10/10 mice during chronic Ang II infusion. Mice were housed individually in metabolic cages, with free access to food and water. Results are expressed as daily averages. n = 8–10 per group. *P < 0.05, ***P < 0.001. Values represent individual measurements and mean ± SEM.
Figure 3
Figure 3. Changes in liver and renal angiotensinogen and renal ACE protein expression in wild-type and ACE 10/10 mice during Ang II infusion.
(A) Angiotensinogen (AGT) and (B) ACE expression were analyzed in total tissue homogenates from wild-type and ACE 10/10 mice 2 weeks after sham operation (uninfused group) or after 2 weeks of Ang II infusion (400 ng/kg/min via minipump). Immunoblots were performed with a constant amount of protein per lane for angiotensinogen, ACE, and β-actin (Supplemental Table 1). Values represent individual measurements and mean ± SEM. n = 6–17 per group. *P < 0.05, **P < 0.01, ***P < 0.001, ****P < 0.0001.
Figure 4
Figure 4. The absence of kidney ACE prevents changes in expression of NKCC2 and NCC induced by Ang II infusion.
Transporter expression was analyzed in whole renal tissue homogenates from wild-type and ACE 10/10 mice 2 weeks after sham operation (uninfused group) or after 2 weeks of Ang II infusion (400 ng/kg/min via minipump). (A) Immunoblots were performed with a constant amount of protein per lane (Supplemental Table 1). (B) Relative abundance of total and NKCC2-P and NCC as well as the phosphorylated/total ratios of is displayed as individual measurements and mean ± SEM. n = 6–8 per group. *P < 0.05, ****P < 0.0001.
Figure 5
Figure 5. The absence of kidney ACE prevents changes in expression of α and γ subunit of ENaC and pendrin induced by Ang II infusion.
Transporter expression was analyzed in whole renal tissue homogenates extracted from uninfused (sham-operated) mice or hypertensive wild-type and ACE 10/10 mice after 2 weeks of Ang II infusion (400 ng/kg/min via minipump). (A) Immunoblots were performed with a constant amount of protein per lane (Supplemental Table 1). (B) Relative abundance is displayed as individual measurements and mean ± SEM. Since cleavage of α and γ subunits is a marker for ENaC activation, the densities of both full-length (FL) and cleaved (CL) α- and γ-ENaC were calculated within each sample and as the resultant ratios of cleaved/full-length ENaC. n = 6–8 per group. *P < 0.05, ***P < 0.001.
Figure 6
Figure 6. The absence of kidney ACE prevents the in vivo activation of NKCC2 and NCC induced by Ang II infusion, as determined by natriuretic responses to specific blockers and confocal microscopy.
(A) Transport activity in wild-type and ACE 10/10 mice was assessed by measuring the natriuretic responses after a single i.p. bolus of furosemide (an NKCC2 blocker; 25 mg/kg) or HCTZ (a NCC blocker; 25 mg/kg). Testing was performed before and after Ang II infusion (400 ng/kg/min). Numbers represent fold increase (arrows) over response in time-matched mice injected with vehicle. n = 7–10. ***P < 0.01, ****P < 0.0001. Values represent individual measurements and mean ± SEM. Basal natriuretic and diuretic response was significant in both wild-type (P < 0.0001 for furosemide, P < 0.01 for HCTZ) and ACE 10/10 mice (P < 0.01 for furosemide, P < 0.05 for HCTZ). (B) Immunofluorescence localization of NKCC2-P and NCC-P (red) in the thick ascending limb and distal tubules of kidneys of uninfused or Ang II–infused wild-type and ACE 10/10 mice. Uninfused and Ang II–infused samples were examined on the same slide with identical settings. Nuclei are stained blue with DAPI. Scale bar: 20 μm.
Figure 7
Figure 7. The absence of kidney ACE prevents the isoform shift of SPAK as well as SPAK and OSR1 phosphorylation induced by Ang II infusion.
(A) SPAK isoform shift. Isoforms were identified using a combination of custom-made antibodies (Supplemental Figure 13) in whole renal tissue homogenates from wild-type and ACE 10/10 mice 2 weeks after sham operation (uninfused group) or after 2 weeks of Ang II infusion (400 ng/kg/min via minipump). Samples were run at a constant amount of protein per lane (Supplemental Table 1). Relative abundance of FL-SPAK, SPAK2, and KS-SPAK is displayed as are individual measurements and mean ± SEM. Since KS-SPAK exerts a dominant-negative effect on SPAK kinase activity, the ratio of FL-SPAK to KS-SPAK (FL/KS-SPAK) provides a measure of SPAK activation. (B) Phosphorylation of SPAK and OSR1. Immunoblots of whole kidney homogenates were performed as described above. Relative abundance of phosphorylated SPAK and OSR1 (pSPAK and pOSR1) is displayed as individual mice and mean ± SEM. n = 6–8 per group. *P < 0.05.
Figure 8
Figure 8. Hypothetical model for the actions of kidney ACE-derived Ang II synthesis in stimulating the activity of sodium transporters in the loop of Henle and distal nephron.
Different conditions, including inflammation, reactive oxygen species, and Ang II, can act synergistically to induce angiotensinogen accumulation in proximal tubule cells, with its subsequent spillover into the tubular lumen and urine. After cleavage by renin and ACE, Ang II is released to trigger the activity of sodium transporters via AT1 receptors. These sequential events are hampered by the absence of kidney ACE. A nephron and the corresponding peritubular vessel are depicted in green and red, respectively. PT, proximal tubule; TAL, thick ascending limb; DT, distal tubule; CD, collecting duct.

Comment in

References

    1. Atlas SA. The renin-angiotensin aldosterone system: pathophysiological role and pharmacologic inhibition. J Manag Care Pharm. 2007;13(8 suppl B):9–20. - PMC - PubMed
    1. Alderman MH, Cohen HW, Sealey JE, Laragh JH. Plasma renin activity levels in hypertensive persons: their wide range and lack of suppression in diabetic and in most elderly patients. Am J Hypertens. 2004;17(1):1–7. doi: 10.1016/j.amjhyper.2003.08.015. - DOI - PubMed
    1. Gonzalez-Villalobos RA, et al. Intrarenal angiotensin-converting enzyme induces hypertension in response to angiotensin I infusion. J Am Soc Nephrol. 2011;22(3):449–459. doi: 10.1681/ASN.2010060624. - DOI - PMC - PubMed
    1. Kobori H, et al. Kidney-specific enhancement of ANG II stimulates endogenous intrarenal angiotensinogen in gene-targeted mice. Am J Physiol Renal Physiol. 2007;293(3):F938–F945. doi: 10.1152/ajprenal.00146.2007. - DOI - PMC - PubMed
    1. Lavoie JL, Lake-Bruse KD, Sigmund CD. Increased blood pressure in transgenic mice expressing both human renin and angiotensinogen in the renal proximal tubule. Am J Physiol Renal Physiol. 2004;286(5):F965–F971. doi: 10.1152/ajprenal.00402.2003. - DOI - PubMed

Publication types

MeSH terms