. 2013 May;123(5):2024-36.
doi: 10.1172/JCI66963. Epub 2013 Apr 24.

A disease-associated PTPN22 variant promotes systemic autoimmunity in murine models

Affiliations

A disease-associated PTPN22 variant promotes systemic autoimmunity in murine models

Xuezhi Dai et al. J Clin Invest. 2013 May.

Abstract

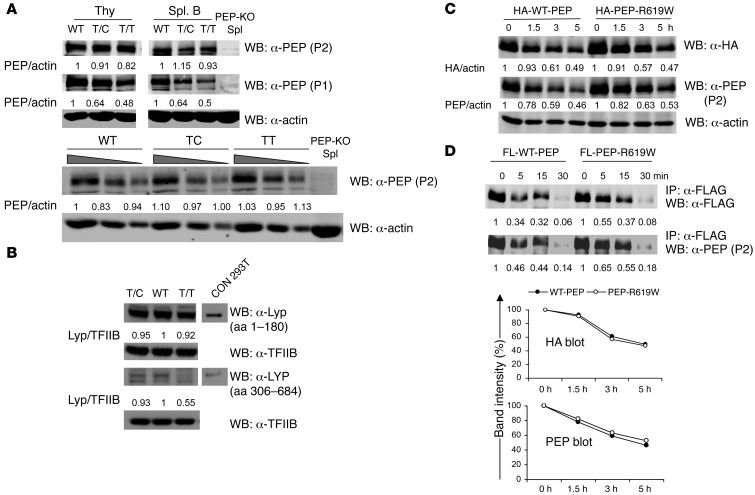
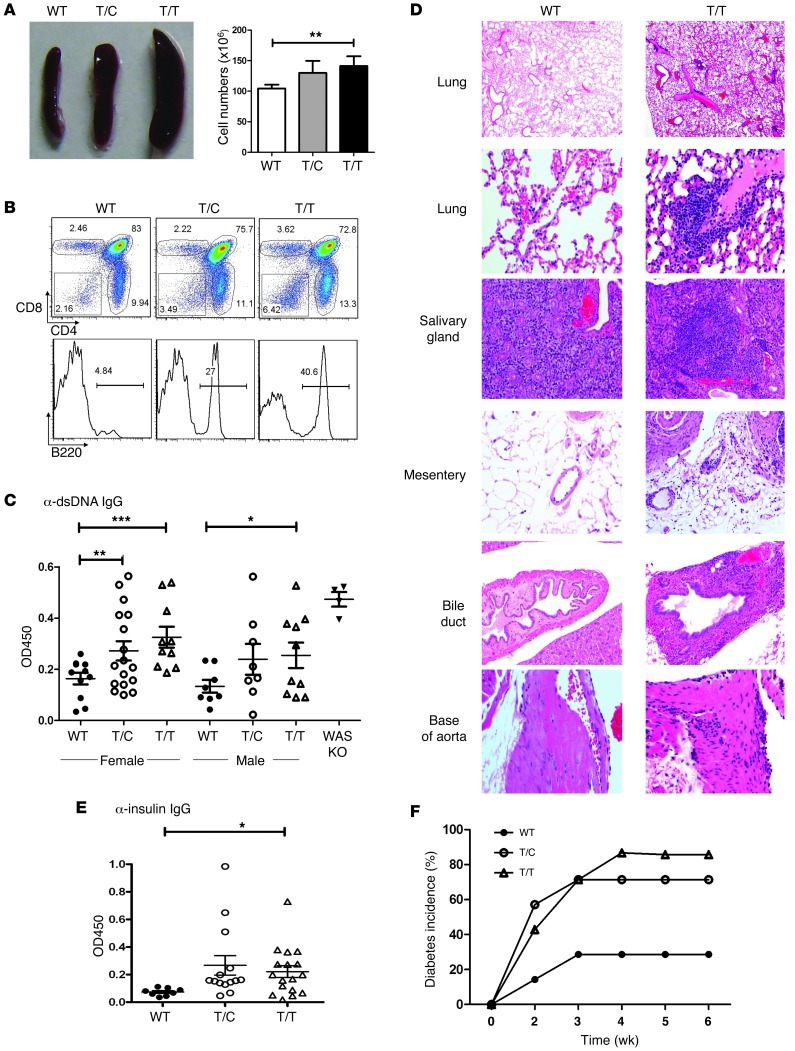
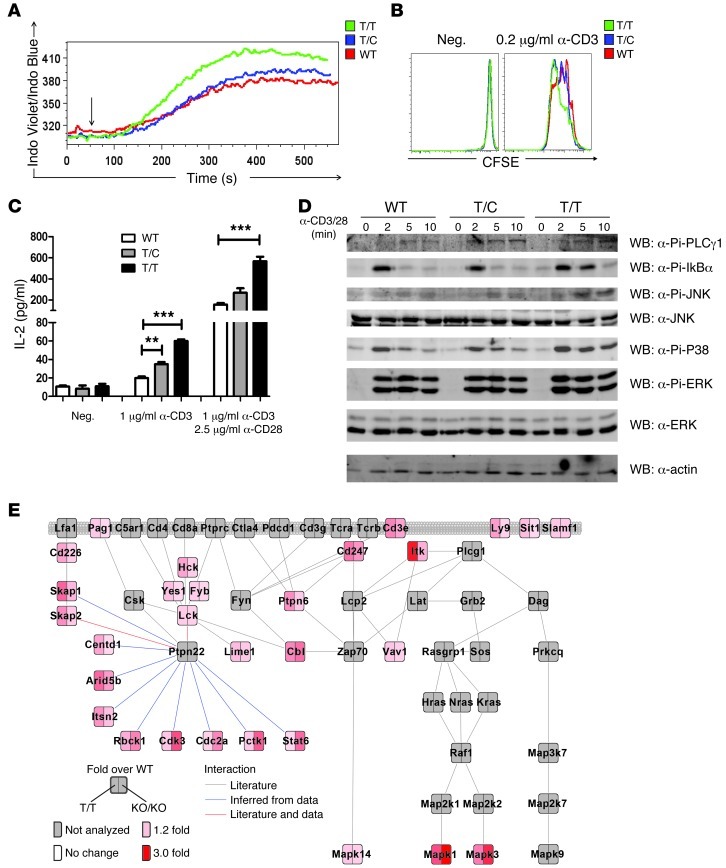
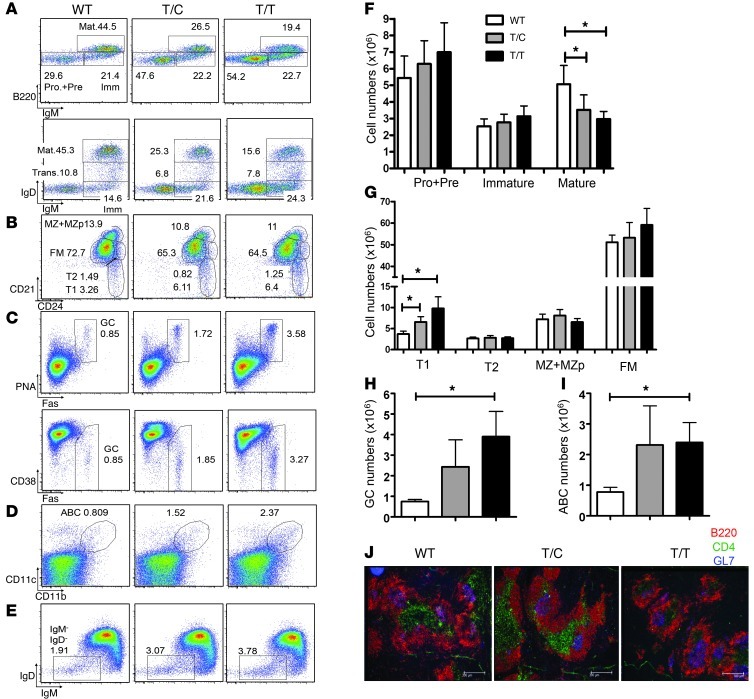
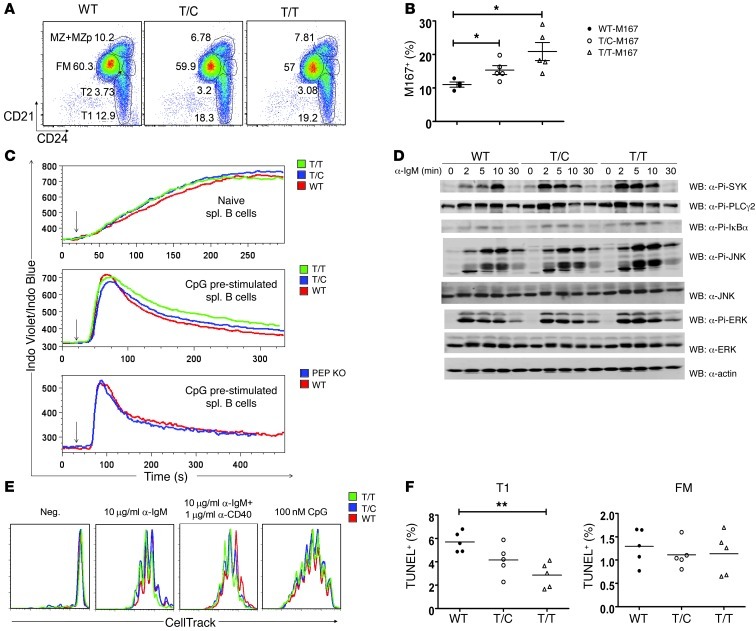
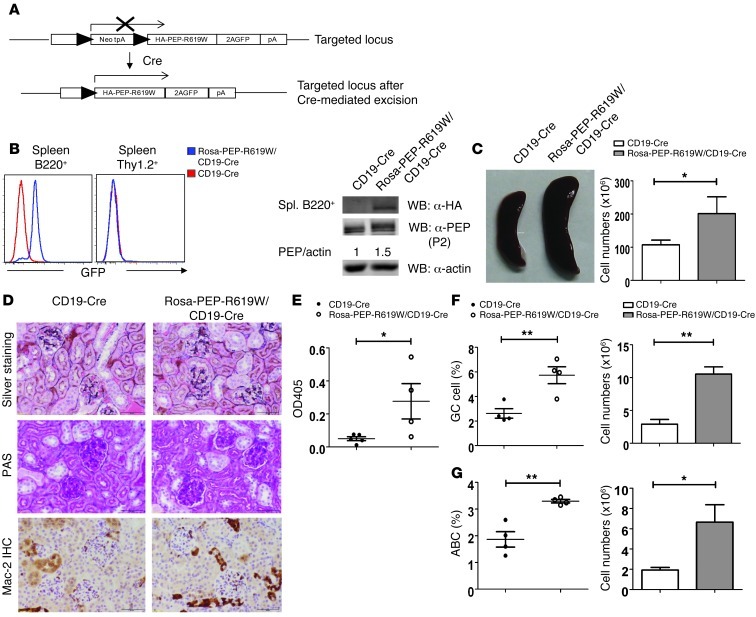
Multiple autoimmune diseases, including type 1 diabetes, rheumatoid arthritis, Graves disease, and systemic lupus erythematosus, are associated with an allelic variant of protein tyrosine phosphatase nonreceptor 22 (PTPN22), which encodes the protein LYP. To model the human disease-linked variant LYP-R620W, we generated knockin mice expressing the analogous mutation, R619W, in the murine ortholog PEST domain phosphatase (PEP). In contrast with a previous report, we found that this variant exhibits normal protein stability, but significantly alters lymphocyte function. Aged knockin mice exhibited effector T cell expansion and transitional, germinal center, and age-related B cell expansion as well as the development of autoantibodies and systemic autoimmunity. Further, PEP-R619W affected B cell selection and B lineage-restricted variant expression and was sufficient to promote autoimmunity. Consistent with these features, PEP-R619W lymphocytes were hyperresponsive to antigen-receptor engagement with a distinct profile of tyrosine-phosphorylated substrates. Thus, PEP-R619W uniquely modulates T and B cell homeostasis, leading to a loss in tolerance and autoimmunity.


Figures

Figure 1
Figure 1. PEP-R619W and LYP-R620W exhibit no deficit in protein stability.
(A) PEP expression in thymocytes and splenic B cells from T/C, T/T, and WT littermates. Cell lysates were subjected to Western blot using anti–PEP-P1, anti–PEP-P2, or anti-actin antibodies. Lower panel shows serial dilution of thymocyte lysates. (B) LYP expression in purified CD3+ T cells from healthy T/T or T/C or control (C/C) subjects. Lysates were blotted using 2 alternative anti-LYP antibodies and probed with anti-TFIIB for protein loading controls. 293T cells overexpressing LYP were used as a positive control. (C) Analysis of PEP half-life in Ramos B cells overexpressing HA-tagged WT or PEP-R619W. Cells were treated with 50 μM CHX for times indicated, and cell lysates were blotted using anti-HA, anti–PEP-P2, and anti-actin antibodies. (D) WT and PEP-R619W exhibit similar calpain-1–mediated protein degradation. Cell lysates from Ramos B cells overexpressing FLAG-tagged WT or PEP-R619W were IP with anti-FLAG antibody, incubated with 0.05 U calpain-1 for indicated times, and subjected to Western blot with anti-FLAG or anti–PEP-P2 antibodies. Graphic displays relative band intensity versus time for each analysis. Numbers denote PEP/actin, LYP/TFIIB, or HA/actin ratios. Data shown are representative of at least 3 independent experiments.
Figure 2
Figure 2. Expression of the PEP variant promotes autoimmunity in a mixed genetic background.
(A) Increased spleen size and cellularity in 6-month-old T/C and T/T mice. Error bars represent SD based on 8 animals/genotype. **P < 0.01. (B) Infiltration of thymus with B cells in aged T/C and T/T animals. Analysis of total thymocytes (top) and double-negative (CD4CD8) thymocytes (bottom) are shown with numbers indicating percentages within total live or double-negative cells. Data in A and B are representative of 8 independent analyses. (C) Anti-dsDNA IgG ELISA was performed using sera from T/C, T/T, and WT littermates and control autoimmune Wiskott-Aldrich syndrome (WAS) knockout mice. Each symbol represents an individual 6-month-old animal; horizontal bars represent mean ± SEM. *P < 0.05; **P < 0.01; ***P < 0.001. (D) H&E-stained tissue sections showing spectrum of histologic lesions in aged knockin mice compared with WT littermates. Original magnification, ×4 (lung, top panel); ×20 (salivary gland, bile duct); ×40 (lung [second panel], mesentery, and base of aorta). (E) Anti-insulin autoantibodies were determined by ELISA using sera from T/C, T/T, and WT littermates. Each symbol represents an individual 6- to 10-month-old animal; horizontal bars represent mean ± SEM. *P < 0.05 (F) STZ-induced diabetes in 6- to 8-week-old male T/C, T/T, and WT littermates. Mice (7/genotype) were treated with 40 mg/kg STZ for 4 consecutive days and blood glucose levels measured twice weekly. Diabetes was defined as glucose levels above 250 mg/dl for 2 consecutive assays. Data are representative of 2 independent experiments.
Figure 3
Figure 3. PEP-R619W alters T cell homeostasis and TCR signaling.
(A) Increased CD4+ memory/effector T cells in aged T/C and T/T versus WT littermates. Splenocytes or LN cells were analyzed by FACS for CD4, CD8, CD44, and CD62L expression. Percentages indicate cells within the CD4+ gate (left panels). Absolute numbers of naive and memory/effector CD4+ cells (right panel). Error bars represent SD based on 8 animals/genotype. **P < 0.01. (B) TCR-induced calcium flux in CD4+CD8+ thymocytes (top) and splenic CD4+ T cells (bottom). Cells were stained with indo-1 AM, anti-CD4, and anti-CD8, then stimulated with biotin-conjugated anti-CD3 antibody and cross-linked by streptavidin (arrow). Ca2+ mobilization was determined by flow cytometry. (C and D) Proliferation of naive (C) and memory/effector (D) CD4+ T cells. CD4+CD25CD62Lhi naive T cells and CD4+CD25CD62Llo/– memory/effector T cells were isolated from 2-month-old T/C, T/T, and WT littermates. Sorted cells were labeled with CellTrace and stimulated with various doses of anti-CD3 with or without anti-CD28. Cell proliferation was determined by dye dilution. (E) PEP-R619W expression enhances antigen-specific T cell responses in vivo. T/C, T/T, and control mice were immunized with OVA in CFA. Splenocytes were isolated 1 week later and stimulated in vitro with OVA peptide. IL-2 production was measured at 24 hours after stimulation by ELISA. Error bars represent SD based on 3 animals/genotype. *P < 0.05; **P < 0.01. Data shown are representative of 8 (A), 3 (B), 4 (C and D), and 2 (E) independent experiments.
Figure 4
Figure 4. PEP-R619W enhances TCR signaling of in vitro–generated effector T cells.
(A) TCR-induced calcium flux of in vitro–generated effector T cells. Purified CD4+ T cells from T/T, T/C, and WT mice were stimulated with anti-CD3/CD28 for 3 days and rested in IL-2 medium for 2 days to generate effector T cells. Ca2+ mobilization was determined by flow cytometry. (B) Enhanced proliferation of T/C and T/T effector T cells. Cells were labeled with CFSE and cultured with anti-CD3; proliferation was determined by CFSE dilution. (C) IL-2 production in response to TCR engagement. In vitro–generated effector T cells were cultured with anti-CD3 with or without anti-CD28, and then IL-2 production was measured by ELISA. Error bars indicate SD of triplicate assays. **P < 0.01; ***P < 0.001. (D) PEP-R619W expression augments phosphorylation of TCR-dependent substrates. Cells were stimulated with anti-CD3/CD28 and cross-linked by secondary antibody for indicated times. Cell lysates were blotted using antibodies as indicated. (E) Phosphoproteome analysis. Effector T cells from T/T, PEP-deficient, and control mice were stimulated with anti-CD3/CD28. Following lysis and trypsinization, peptides were labeled with iTRAQ reporters and mixed. Tyrosine-phosphorylated peptides were isolated and analyzed using high-resolution mass spectrometry. Quantification of phosphopeptides corresponding to proteins previously described to regulate TCR signaling and/or found to be regulated by Ptpn22 are integrated into a schematic of the TCR pathway. Phosphopeptide abundance in PEP-R620W (left) and knockout (right) relative to control is depicted. Data are representative of at least 3 (AD) and 2 (E) independent experiments.
Figure 5
Figure 5. Altered B cell homeostasis in aged PEP-R619W knockin mice.
(AE) Representative FACS analysis of B cell populations in various tissues derived from 6-month-old T/C, T/T, and WT littermates. Numbers indicate relative percentages of each developmental population within the B220+ gate. (A) Decreased mature recirculating B cells in BM in knockin mice. BM cells were analyzed for B220, IgM, and IgD expression. (B) Increased T1 B cells in knockin mice. Splenocytes were stained for B220, CD21, and CD24 expression. Subsets were defined as CD21loCD24hi (T1), CD21intCD24hi (transitional 2, T2), CD21hiCD24hi (MZ and MZ progenitor; MZ + MZp), and CD21intCD24int (FM) B cells. (C) Increased GC B cells in knockin mice. Splenocytes were analyzed for B220, PNA, CD38, and FAS expression. (D) Increased ABC in knockin mice. Splenocytes were analyzed for B220, CD11b, and CD11c expression. (E) Increased IgDIgM isotype switched B cells in knockin mice. Splenocytes were analyzed for B220, IgD, and IgM expression. (FI) Absolute numbers of each BM B cell subset (F), splenic B cell subset (G), GC B cells (H), and ABCs (I). Error bars depict SD based on 8 (FH) and 6 (I) mice/genotype. *P < 0.05. (J) Immunofluorescent staining of splenic sections showing representative follicles using B220 (red), CD4 (green), and GL7 (blue) antibodies. Scale bars: 300 μm. Data shown are representative of 8 (AC), 6 (D and E), and 2 (J) independent experiments.
Figure 6
Figure 6. PEP-R619W expression alters B cell selection, augments BCR signaling, and partially protects immature B cells from apoptosis.
(A) Increased T1 B cell in 6- to 8-week-old knockin mice. Splenic B cell subsets were defined as in Figure 5. (B) Enhanced selection for M167-Id+ cells in the MZ compartment in young knockin mice. Splenocytes were stained with anti-B220, anti-CD21, anti-CD24, and anti-M167-Id–specific (where Id, indicates idiotype) antibodies. Percentage of M167-Id+ cells within the MZ gate (CD21hiCD24hiCD23lo/–) is displayed. Each symbol represents an individual mouse; horizontal bars represent mean ± SEM. *P < 0.05. (C) BCR signaling in naive and CpG prestimulated B cells. Naive B cells (top), CpG prestimulated B cells from T/C, T/T, and WT littermates (middle), and from PEP-deficient and control mice (bottom) were stimulated with anti-IgM antibody at the times indicated by arrows. Induction of Ca2+ mobilization was determined by flow cytometry. (D) PEP-R619W expression promotes enhanced phosphorylation of BCR-dependent substrates in CpG-prestimulated B cells. CpG-prestimulated B cells were stimulated with anti-IgM antibody for indicated times, and cell lysates were blotted using the indicated antibodies. (E) Proliferation of T/C, T/T, and control B cells. Purified CD43 splenic B cells were labeled with CellTrace and stimulated as indicated; proliferation was determined by CellTrace dilution. (F) Apoptosis analysis of T1 and FM B cells. Splenocytes were stained with anti-B220, anti-CD21, and anti-CD24. T1 and FM B cells were analyzed for apoptosis by TUNEL. Each symbol represents an individual mouse. *P < 0.05; **P < 0.01. Data shown are representative of 6 (A), 3 (C and E), and 2 (D) independent experiments.
Figure 7
Figure 7. B lineage–restricted expression of PEP-R619W is sufficient to trigger autoimmunity in a mixed genetic background.
(A) Schematic representation of the Rosa26-targeting strategy. Cre-mediated deletion of the STOP cassette (Neo-tpA) induces coexpression of HA-tagged PEP-R619W and cis-linked GFP. (B) Expression of cis-linked GFP solely in B lineage cells in Rosa-PEP-R619W/CD19-Cre mice. Splenocytes were analyzed by FACS for GFP, B220, and Thy1.2 expression. Purified splenic B lysates were subjected to Western blot with anti-HA, anti–PEP-P2, and anti-actin antibodies. Numbers denote PEP/actin ratio. (C) Increased spleen size and splenic cellularity in 10-month-old Rosa-PEP-R619W/CD19 Cre mice. Error bars depict SD (4 mice/genotype). *P < 0.05. (D) Histology analysis of kidneys from Rosa-PEP-R619W/CD19-Cre mice and CD19-Cre control mice. Three of 4 Rosa-PEP-R619W/CD19-Cre mice evaluated exhibited significant renal abnormalities compared with control animals. Scale bars: 50 μm. (E) Anti-dsDNA ELISA using sera from 10-month-old Rosa-PEP-R619W/CD19-Cre mice and CD19-Cre littermates. Each symbol represents an individual mouse. *P < 0.05. (F) Increased GC B cell percentage and absolute numbers in Rosa-PEP-R619W/CD19-Cre mice. Splenocytes analyzed by FACS for B220, CD38, and FAS expression. (G) Increased ABC percentage and absolute numbers in Rosa-PEP-R619W/CD19-Cre mice. Splenocytes were analyzed for B220, CD11b, and CD11c expression. Each symbol represents an individual animal, horizontal bars represent mean ± SEM, and error bars represent SD (4 animals/genotype). *P < 0.05; **P < 0.01.

Comment in

References

    1. Bottini N, et al. A functional variant of lymphoid tyrosine phosphatase is associated with type I diabetes. Nat Genet. 2004;36(4):337–338. doi: 10.1038/ng1323. - DOI - PubMed
    1. Bottini N, Vang T, Cucca F, Mustelin T. Role of PTPN22 in type 1 diabetes and other autoimmune diseases. Semin Immunol. 2006;18(4):207–213. doi: 10.1016/j.smim.2006.03.008. - DOI - PubMed
    1. Vang T, Miletic AV, Arimura Y, Tautz L, Rickert RC, Mustelin T. Protein tyrosine phosphatases in autoimmunity. Annu Rev Immunol. 2008;26:29–55. doi: 10.1146/annurev.immunol.26.021607.090418. - DOI - PubMed
    1. Chung SA, Criswell LA. PTPN22: its role in SLE and autoimmunity. Autoimmunity. 2007;40(8):582–590. doi: 10.1080/08916930701510848. - DOI - PMC - PubMed
    1. Vang T, et al. Autoimmune-associated lymphoid tyrosine phosphatase is a gain-of-function variant. Nat Genet. 2005;37(12):1317–1319. doi: 10.1038/ng1673. - DOI - PubMed

Publication types

MeSH terms

Substances