. 2013 Aug 15;216(Pt 16):3071-83.
doi: 10.1242/jeb.087742. Epub 2013 Apr 25.

Visually guided gradation of prey capture movements in larval zebrafish

Affiliations

Visually guided gradation of prey capture movements in larval zebrafish

Bradley W Patterson et al. J Exp Biol. .

Abstract

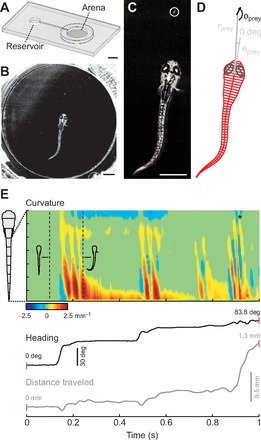
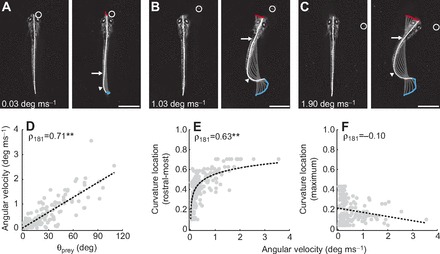
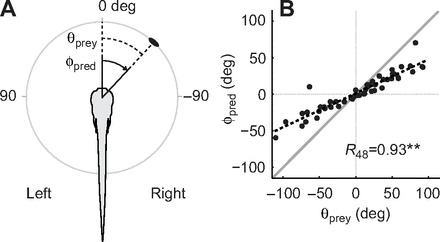
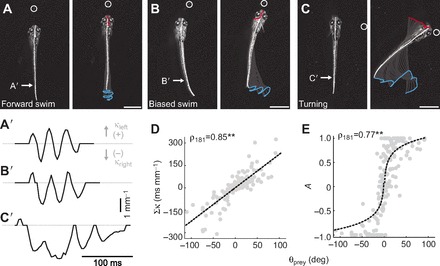
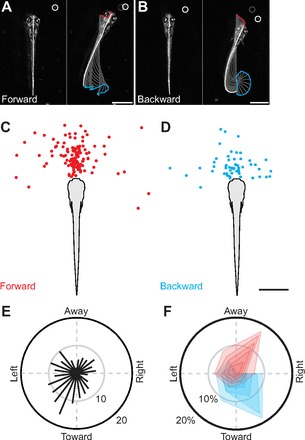
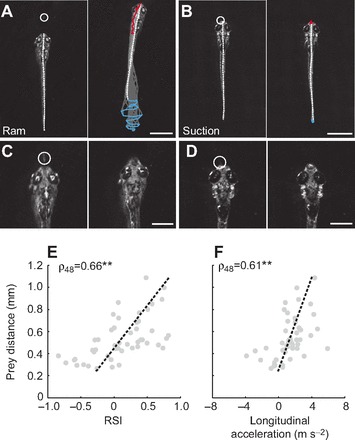
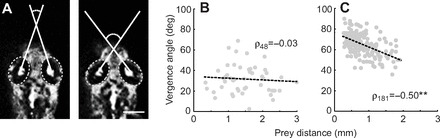
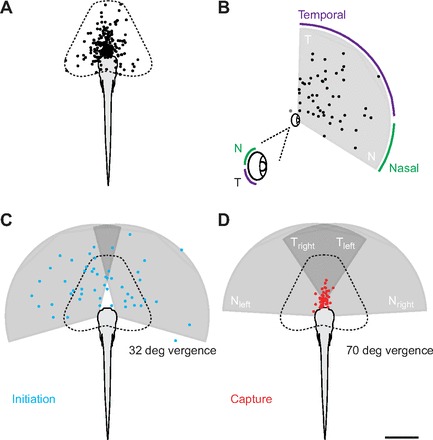
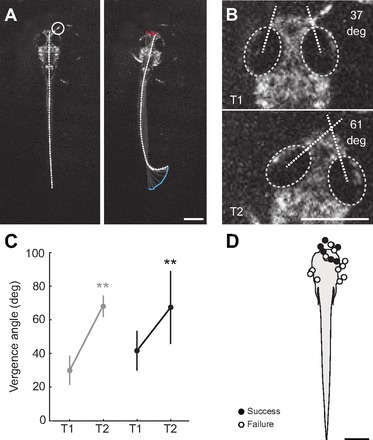
A mechanistic understanding of goal-directed behavior in vertebrates is hindered by the relative inaccessibility and size of their nervous systems. Here, we have studied the kinematics of prey capture behavior in a highly accessible vertebrate model organism, the transparent larval zebrafish (Danio rerio), to assess whether they use visual cues to systematically adjust their movements. We found that zebrafish larvae scale the speed and magnitude of turning movements according to the azimuth of one of their standard prey, paramecia. They also bias the direction of subsequent swimming movements based on prey azimuth and select forward or backward movements based on the prey's direction of travel. Once within striking distance, larvae generate either ram or suction capture behaviors depending on their distance from the prey. From our experimental estimations of ocular receptive fields, we ascertained that the ultimate decision to consume prey is likely a function of the progressive vergence of the eyes that places the target in a proximal binocular 'capture zone'. By repeating these experiments in the dark, we demonstrate that paramecia are only consumed if they contact the anterior extremities of larvae, which triggers ocular vergence and tail movements similar to close proximity captures in lit conditions. These observations confirm the importance of vision in the graded movements we observe leading up to capture of more distant prey in the light, and implicate somatosensation in captures in the absence of light. We discuss the implications of these findings for future work on the neural control of visually guided behavior in zebrafish.

Keywords: Danio rerio; behavior; kinematics; visuomotor integration.


Figures

Fig. 1.
Fig. 1.
Collection and analysis of prey capture videos. (A) Diagram of the custom-built testing chamber used for collecting high-speed videos of prey capture behavior. Scale bar, 5 mm. (B) Image of zebrafish larva in the central arena performing prey capture behavior. Scale bar, 1 mm. (C) Enlarged image of the larva from B (note the paramecium in the circle). Scale bar, 1 mm. (D) Information extracted from the image in C following tracking analyses. Red lines indicate the automated processing of axial kinematics whereas black and gray lines indicate the manual measurements of eye and paramecium orientations. The long axes of the eyes are marked by a line bisecting them. Using these data, we could determine the proximity of the paramecium (rprey), its azimuth (θprey) and its direction of travel (ϕprey) relative to the fish's body (0 deg reference). (E) A representative trial from a different fish illustrating the curvature of the tail (top panel), the heading of the fish relative to its original heading before detecting the paramecium (middle panel) and the distance traveled (bottom panel) during the entire prey capture sequence. All measurements are presented on the same time scale. In the heat map of curvature, red represents positive values to the left, while blue represents negative values to the right. Outlines of body shape from time points indicated by the dashed lines are included to illustrate this point. The asterisk indicates the point of capture in this sequence.
Fig. 2.
Fig. 2.
Speed and shape of the initial turn following prey detection. (A–C) Frames from high-speed videos illustrating differences in the speed of turns related to prey location. Paramecium location varies in azimuth, from small to large angles (A–C) from the mid-sagittal plane. The speed of turns is indicated in the respective panels. The locations of the most rostral and maximum curvatures are indicated with arrows and arrowheads, respectively. Frames on the left are a single snapshot of the larva just prior to movement, while those on the right are the point of maximum curvature during the turn. In this and subsequent figures, gray lines represent the midline of the fish and are presented at 4 ms intervals to demonstrate the change in curvature during this period. Movement of the mouth (red) and the tip of the tail (blue) is also shown. A circle indicates paramecium location. All scale bars, 1 mm. (D) The maximum angular velocity generated during the initial turn scales with the absolute value of the azimuth of the paramecium (θprey, N=183 bends during 50 capture trials in 17 larvae). Trend line is a linear fit. (E) The most rostral location at which bending was observed above 0.4 mm−1 plotted against the magnitude of the angular velocity of turns. Axial bending occurs more rostral with increased angular velocity. Body length is normalized from 0 (tip of the tail) to 1 (tip of the head). We can track this relationship up to the level of the swim bladder (~0.7), beyond which curvature values were set to 0 mm−1 (see Materials and methods). Trend line is a linear fit to the natural log of curvature location versus angular velocity. (F) The location of maximum tail curvature does not vary systematically with angular velocity. Body length is normalized from 0 (tip of the tail) to 1 (tip of the head). Trend line is a linear fit. **P<0.001 following Spearman's rank test (ρ).
Fig. 3.
Fig. 3.
Magnitude of the initial turn based on prey location. (A) Diagram illustrating the prey azimuth (θprey, dashed lines) and the corresponding turn angle of the larva (ϕpred, solid lines). Locations and turns to the right are negative, those to the left are positive. (B) Turn angles (ϕpred) relative to prey azimuth (θprey) at the very beginning of the capture behavior. The thick gray line represents unity, where the response would precisely match prey location. Larvae consistently underestimated prey location, as demonstrated by the relatively shallow slope compared with unity. Trend line is a linear fit. **P<0.001 following Pearson's product-moment test (R).
Fig. 4.
Fig. 4.
Biasing of movements following the initial turn. (A–C) Frames from high-speed videos illustrating differences in the directionality of movements following the initial orientation turn. These range from forward swimming (A), to biased swimming (B), to unilateral turning (C). Frames on the left are a single snapshot of the larva just prior to movement, while those on the right are at the completion of the movement. Other conventions are as indicated in Fig. 2A–C. All scale bars, 1 mm. In A′–C′, raw curvature data from the regions indicated by the arrows in A–C provide a means to quantify the relative symmetry of leftward curvature (positive κ values) and rightward curvature (negative κ values) with respect to paramecium location. As paramecium location progressively moves to the right, so too does the weight of curvature to the right side, from symmetrical swimming (A′) to biased swimming (B′) to turning (C′). Dashed gray line indicates zero curvature. (D) Integrated curvature (Σκ) varies systematically with the azimuth of the prey (N=183 bouts). Trend line is a linear fit. (E) A normalized measure of tail movement asymmetry (A, Eqn 3) also varies with paramecium location. A tail movement asymmetry value of 0 represents symmetrical displacement whereas asymmetries of 1 or −1 represent exclusively leftward or rightward displacement, respectively (see Materials and methods). There is saturation of this relationship as asymmetries approach completely leftward or rightward displacements (N=183 bouts). Trend line is a linear fit to the natural log of movement asymmetry versus prey azimuth. **P<0.001 following Spearman's rank test (ρ).
Fig. 5.
Fig. 5.
Forward versus backward movement during prey capture. (A,B) Frames from high-speed videos illustrating differences in the direction of larval movement, which appear unrelated to prey location. Based on positive versus negative values in longitudinal velocity, movements are described as forward (A) or backward (B). Frames on the left are a single snapshot of the larva just prior to movement, while those on the right track movements up to a fixed time interval (132 ms). Other conventions are as indicated in Fig. 2A–C. All scale bars, 1 mm. (C,D) Location of the paramecium immediately before forward (N=128 bouts, C) or backward (N=55 bouts, D) movements of the larvae. The distributions of paramecia are largely overlapping. Scale bar, 1 mm. (E) Histogram plotted on a polar axis indicating the direction of movement of the paramecia for all trials, relative to the fish. Bar length indicates the number of samples per 15 deg bin (N=183). (F) Polar plot indicating the direction of paramecium movement related to whether the larva moved forward (red) or backward (blue). Contours represent the percentage of the total number of trials per 60 deg bin. From the center outward, each contour represents 10% increments. The first contour is the 90–100th percentile of larval velocity, the second is the 80–100th percentile, and so on to the 50–100th percentile in both the forward (N=128) and backward (N=55) directions. Statistics for the fastest 10–50% of responses using Mann–Whitney U-tests are as follows: 10%: U=11, Z=2.45, P<0.05, N=19; 20%: U=53, Z=2.99, P<0.01, N=37; 30%: U=130, Z=3.52, P<0.001, N=55; 40%: U=258, Z=3.64, P<0.001, N=73; and 50%: U=446, Z=3.81, P<0.001, N=92. Larvae back up when paramecia are moving toward them, but advance when paramecia are moving away.
Fig. 6.
Fig. 6.
Different capture strategies based on distance. (A,B) Frames from high-speed videos illustrating the performance of ram-type (A) and suction-type (B) capture maneuvers. Frames on the left are a single snapshot of the larva just prior to movement, while those on the right are at the completion of the movement. Other conventions are as indicated in Fig. 2A–C. Scale bars, 1 mm. (C,D) Higher magnification frames from the same capture sequences as in A and B, illustrating dorsal head flexion during ingestion. Frames on the left are 8 ms before the larvae ingest the paramecia, while frames on the right are at the point of ingestion. A circle indicates paramecium location. Scale bars, 0.5 mm. (E) Distance of the larva from the paramecium versus the ram–suction index (RSI) score at the initiation of capture movements demonstrates a gradation in capture response (−1=suction, 1=ram). At short distances, the movements tend to be more suction-like and as distance increases, the movements become more ram-like (N=50). Trend line is a linear fit. (F) Distance of the larva from the paramecium versus the maximum longitudinal acceleration of the final capture swim also demonstrates a gradation in response. As the distance from the paramecium increases, the maximum longitudinal acceleration also increases. At the shortest distances, negative accelerations are observed, indicating backward movements (N=50). Trend line is a linear fit. **P<0.001 following Spearman's rank test (ρ).
Fig. 7.
Fig. 7.
Conjugate vergence of the eyes during prey capture. (A) Frames from a high-speed video illustrating low (left, 37 deg) and high (right, 71 deg) eye vergence angles. Scale bar, 250 μm. (B) Eye vergence angles immediately before detection of the paramecium (N=50). There is no relationship between vergence and distance from prey prior to detection. Trend line is a linear fit. (C) Eye vergence angles immediately after detecting the prey (N=183). Vergence data following the capture maneuver are not included here (N=50). Once the capture sequence is initiated, the eyes increasingly verge as a function of distance from the paramecium. Trend line is a linear fit. **P<0.001 following Spearman's rank test (ρ).
Fig. 8.
Fig. 8.
Motor and sensory volumes during prey capture. (A) Schematic diagram representing the two-dimensional (2D) coronal plane projection of the motor volume of zebrafish larvae during prey capture. This was calculated by plotting the end-point of the mouth for every bout of movement during the 50 prey capture trials (N=233) and symmetrically circumscribing the area encompassed by these points. (B) Schematic diagram representing the 2D coronal plane projection of the sensory volume of zebrafish larvae during prey capture. This was calculated by plotting the location of paramecium relative to eye-fixed coordinates immediately prior to the initiation of prey capture behavior (N=50). Detection using the left and right eye is represented as a single eye. A cone encompassing paramecia at the furthest distance and largest angles in azimuth was then drawn. A single gray data point outside the field represents a paramecium that came into contact with the larvae and was excluded from our estimation of the sensory volume. The inset is a larger representation of the eye marking the temporal (T) and nasal (N) retina, and the corresponding locations in space representing their receptive fields. (C) Using an average vergence angle just prior to detection (mean 32±14 deg, range 3–69 deg; N=50) we can plot the motor volume and monocular sensory volumes and relate this to the location of paramecia at the initiation of prey capture behavior. Paramecia are distributed throughout the union of the two monocular sensory volumes. (D) As in C, we can use an average vergence angle just prior to capture (mean 70±10 deg, range 42–90 deg; N=50) and relate both motor and sensory volumes to paramecium location. The culmination of axial and ocular movements places paramecia in a clear ‘capture zone’ well within the motor volume and the binocular temporal retinal fields. Temporal and nasal receptive fields are indicated for both the right and left eyes. Scale bar, 1 mm.
Fig. 9.
Fig. 9.
Prey capture behavior in the dark. (A) Frames from a high-speed video of prey capture behavior in the dark. The frame on the left is a single snapshot of the larva just prior to movement, while that on the right is at the point of capture. Other conventions are as indicated in Fig. 2A–C. Capture movements produced in the dark are very similar to those initiated at close proximity in lit conditions. (B) Images extracted from the prey capture video in A, demonstrating an increase in eye vergence coincident with the suction-like capture strategy. T1, 44 ms before a movement to capture the paramecium; T2, during ingestion. (C) Vergence values at close proximity (<1 mm) in the light immediately before detection (T1) and immediately before capture (T2) are in gray. Vergence values in the dark just before moving to capture the paramecium (T1) and at the point of ingestion (T2) are in black. The significant increase in vergence observed in the dark is similar to that observed at close proximity in the light, albeit more variable. **P<0.001, Wilcoxon matched pairs test. (D) Schematic diagram of the locations of paramecia at the initiation of successful dark captures (N=7) and unsuccessful attempts (N=13). Capture attempts were very rare in the dark and were only initiated when the paramecium was in very close proximity to the fish. All scale bars, 0.5 mm.

Similar articles

Cited by

References

    1. Ahrens M. B., Li J. M., Orger M. B., Robson D. N., Schier A. F., Engert F., Portugues R. (2012). Brain-wide neuronal dynamics during motor adaptation in zebrafish. Nature 485, 471-477 - PMC - PubMed
    1. Angeles Luque M., Pilar Pérez-Pérez M., Herrero L., Torres B. (2005). Involvement of the optic tectum and mesencephalic reticular formation in the generation of saccadic eye movements in goldfish. Brain Res. Brain Res. Rev. 49, 388-397 - PubMed
    1. Baier H., Klostermann S., Trowe T., Karlstrom R. O., Nüsslein-Volhard C., Bonhoeffer F. (1996). Genetic dissection of the retinotectal projection. Development 123, 415-425 - PubMed
    1. Bastian J. (1982). Vision and electroreception - integration of sensory information in the optic tectum of the weakly electric fish Apteronotus albifrons. J. Comp. Physiol. 147, 287-297
    1. Bhatt D. H., McLean D. L., Hale M. E., Fetcho J. R. (2007). Grading movement strength by changes in firing intensity versus recruitment of spinal interneurons. Neuron 53, 91-102 - PubMed

Publication types

LinkOut - more resources